
'The Pause' vs. 'The Surge'
What to think about this year’s very rapid warming

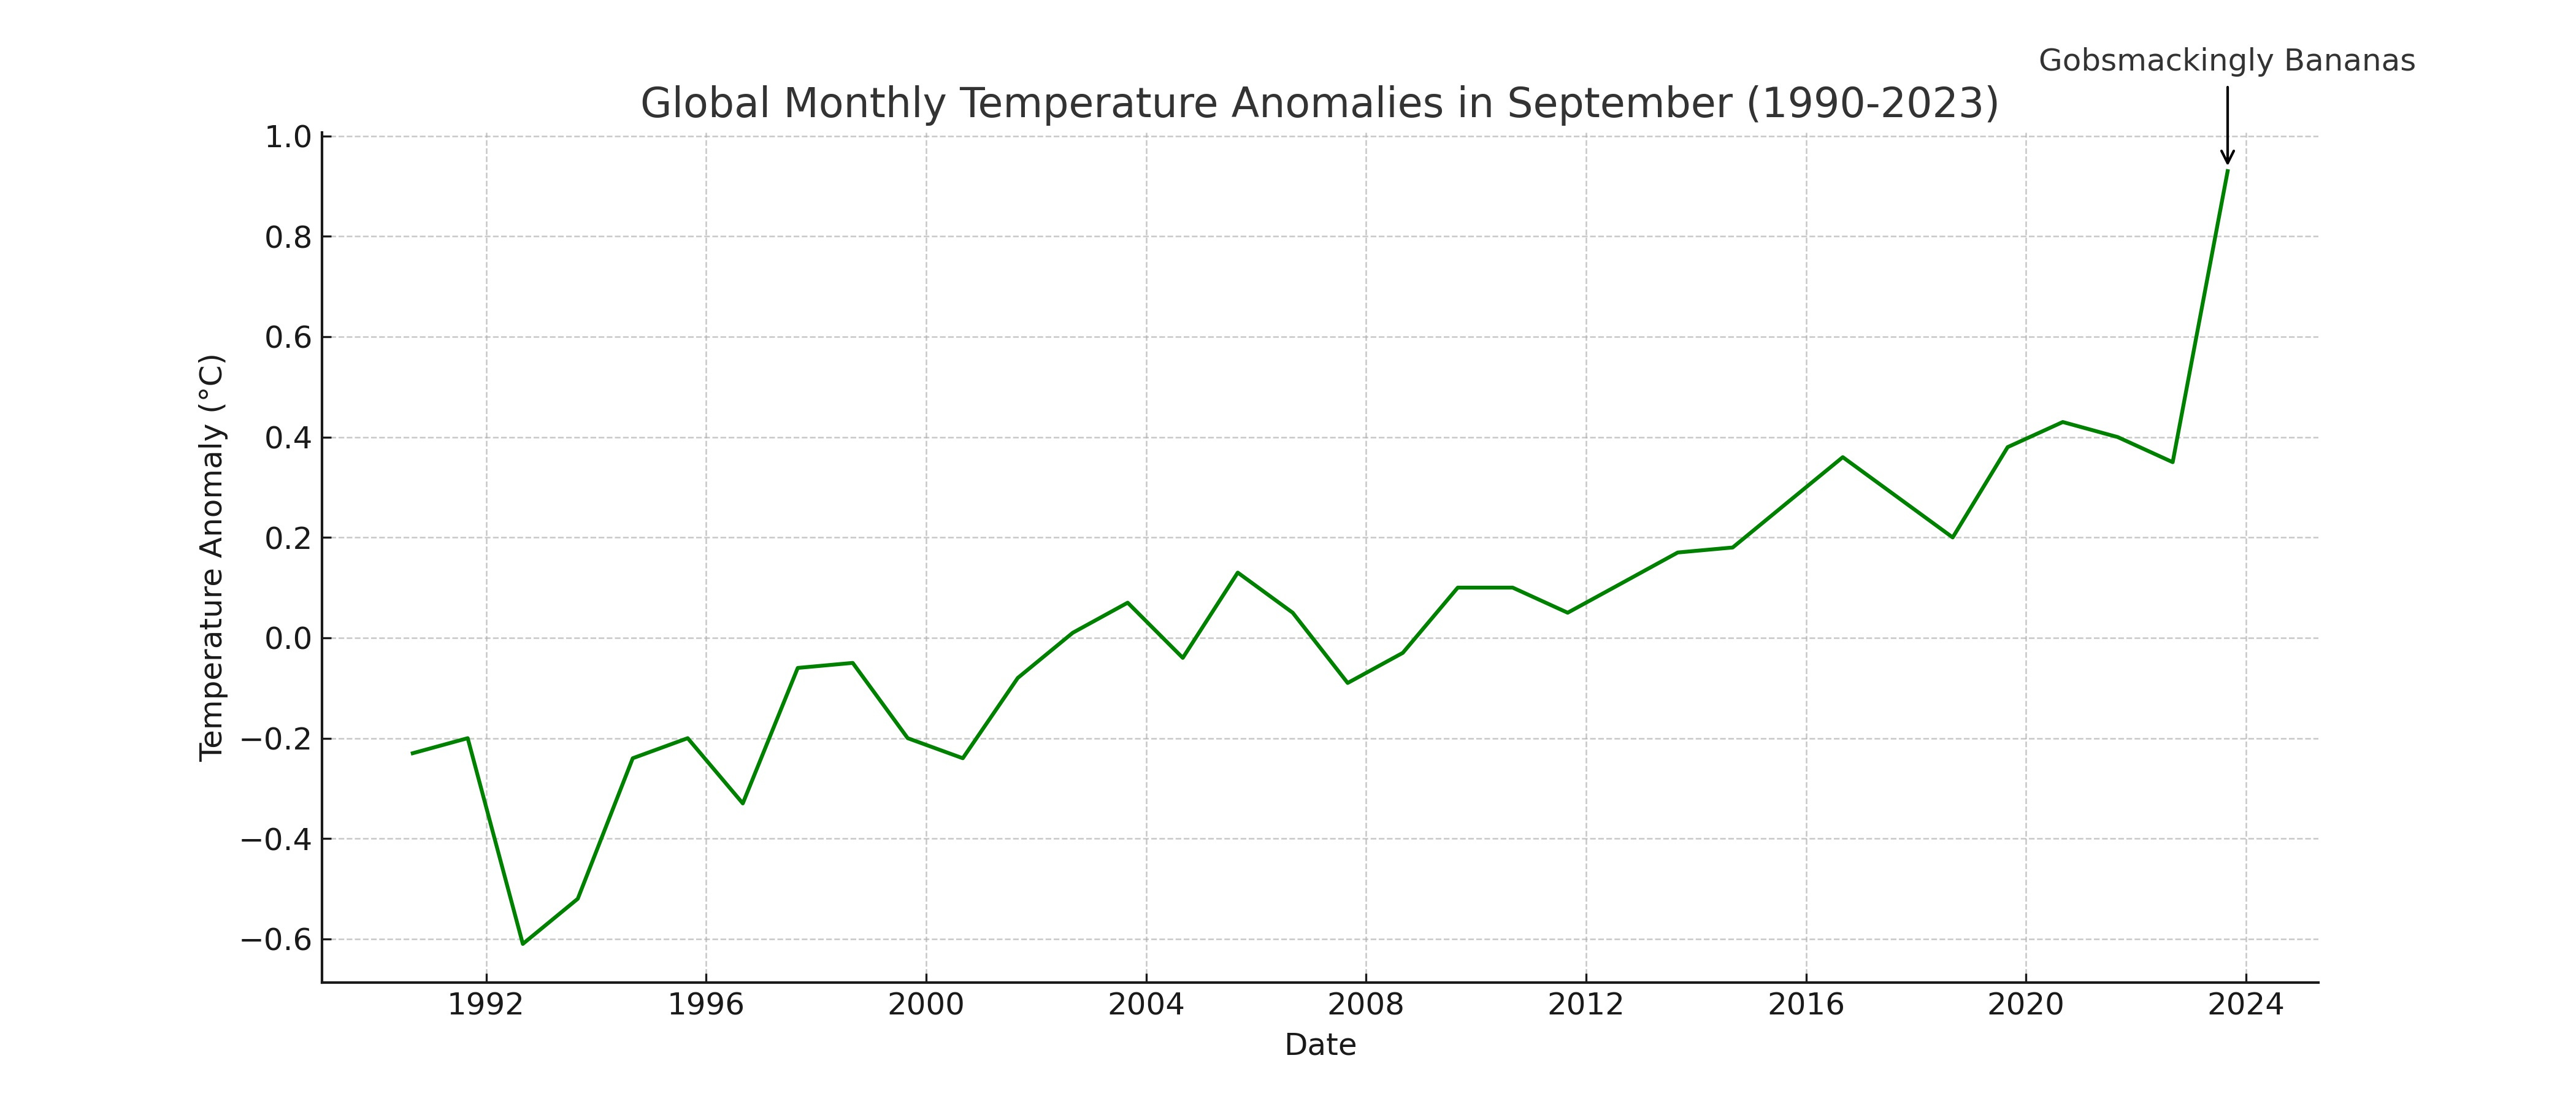
This summer has been incredibly hot, as Zeke wrote a few weeks ago. But then September came along and its extreme warmth was so astonishing that plots had to dramatically expand their y-axis to get the month in. Climate scientists, rarely a group with nothing to say, have been at a loss for words to describe it. Zeke called it “gobsmackingly bananas,” a term that seems to have stuck.
I’ve been getting a lot of calls from reporters asking the same thing: what’s going on? Have we reached a tipping point? Have we broken the climate?
The pause
In one way, this feels like deja vu from the early 2010s, when climate deniers were saying, “Global warming has stopped!”

As with most denier arguments, it was based on a nugget of truth: the trend in global average surface temperatures between the late 1990s and mid 2010s was indeed close to zero, a phenomenon that became known as the pause or the hiatus.
Deniers implied that this somehow challenged climate science, but the scientific community always knew that warming would eventually resume. The oceans were accumulating energy over this entire time, so it eventually had to appear at the surface as increasing temperatures. The only question was when.
It was also obvious how you can claim no warming over short periods (e.g., a decade) while the climate was actually warming. To understand this, you can think of the global temperature record as the sum of a long-term trend, driven by the increase in carbon dioxide and other greenhouse gases, and short-term variability from things like El Nino-La Nina cycles:

If you add these components up, you get something that’s (at least schematically) similar to the observed temperature record.

Once you see this, it’s easy to get a zero or even negative trend in a world that’s warming — you just carefully pick your start year to be hot and your end year to be cold:

So when Ted Cruz says in 2015: “… satellite data demonstrate for the last 17 years, there’s been zero warming,” you can see what’s he’s doing. He’s starting in a very hot year (1998) and ending in a cool year (2015):

This is supremely dishonest data analysis. But the more important fact is this: by judiciously picking your endpoints, you can almost always argue that global warming has stopped:
The pause ultimately ended in 2016 when temperatures associated with an El Nino smashed previous records — and the Earth resumed warming1. When looking at the long-term temperature record today, it agrees well with what the climate models have predicted for the last few decades.
At this point, I’m reasonably sure that the pause was a big nothing. It was probably just random variability of the climate system, perhaps combined with a few other factors, like slightly reduced radiative forcing due to several small factors. There’s nothing there to challenge our understanding of the climate system or projections of the future.
The surge
As a counterpoint to the pause, let’s call the extreme temperatures of this year ‘the surge’. Like the pause, people are looking for long-term lessons from a short snippet of the climate record. That’s dangerous: as we saw with the pause, short-term climate variability can mislead you about the future of the climate.
This is not to say that things are not changing. If you look at the ensemble average of CMIP6 models, we see that the average trend over 1970-2014, 0.22C/decade, increases to 0.30C/decade over 2015-20302.
Given how good the climate models have been at predicting global average surface temperature, we ought to give significant deference to this prediction. I remain open to arguments that the models are underestimating (or overestimating) future warming, but the burden of proof is on those trying to make the case.
Ultimately, nature will settle this just as it settled the hiatus. If we continue to see extraordinary warmth for the next 3-5 years, even after the current El Niño ends, we’ll know that something fundamental has changed in our climate system. However, I suspect that things will settle down and the climate will continue evolving along the pathway charted by the climate models.
This provides me no comfort, though. My biggest fear is not that the physical climate system spins out of control, but that we reach tipping points in the economic and social systems due to climate change, such as an implosion of the insurance market. The impacts of climate change are strongly non-linear, so our society could be much closer to a catastrophic tipping point than we realize. That’s what keeps me up at night.
Amusingly, climate deniers now say, “There’s been no warming since 2016”. Without doubt, in the future they’ll be saying, “There’s been no warming since 2023”.
Thanks to Zeke for calculating these numbers.
I've watched the soils warm up here in PA, OH, NY, WV since the late 80s. I became particularly concerned in winter 2011/12 when the soils didn't freeze at all. Now its a common occurrence, even the epipedon doesn't freeze except for the top inch or two. And now other soil scientist speak of their shock on the abrupt permafrost thaw in the northern climes! Why they were surprised that rain would thaw permafrost, I don't know, because I've been expecting it since 2011, maybe before if I really examine my past notes. Everyone speaks of the record warmth of the oceans, but I suggest they check what's under their feet. There's a lot of warmth stored there.
Why does the 0 point for graphs keep changing? I had thought the reference was "pre-industrial" temperatures. But many graphs had anomalies relative to average from 1900 to 1970. Now, many seem to use average from 1991-2020. It makes it hard to compare over time.
Or do different groups use different standards? If so, why?