
How climate change influences extreme weather
How science shows us how warming makes heat waves, floods, hurricanes, and wildfires more likely or more severe — and why this science is becoming a major public-policy battleground.

I am finalizing a textbook on climate risk and am posting chapters as I finish them. I’d previously posted chapters about embedded energy, physical climate risk, and transition risk. This post is a chapter on attribution of extreme weather to climate change. It is an emerging battleground in the public debate over climate change, so this chapter is an opportunity to get up to speed on the science.
Introduction
In the aftermath of any major weather disaster, the question inevitably arises: “Did climate change cause this disaster?” However, this is a bad way to think about the problem. Climate change does not cause a rainstorm, a heatwave, or a hurricane in a direct sense. These hazards would still occur in a world without human influence on the climate: hurricanes would still form over warm ocean waters, heatwaves would remain a product of stationary high-pressure systems, and low-pressure systems will always generate rain and the occasional flood.
But climate change can make these events more intense. It takes a heatwave and pushes the temperature higher. It adds moisture to a rain event, generating more intense rainfall, enhancing flooding. Warmer oceans make a hurricane’s winds stronger and its rainfall more severe.
Therefore, the scientifically interesting question is not “Did climate change cause this?”, but about influence:
1. How much more likely did climate change make this event?
2. How much more intense did climate change make this event?
Answering these questions is the work of a rapidly advancing field of science called Extreme Event Attribution. This chapter will explore the methods scientists use to disentangle the roles of natural variability and climate change.
To understand the two different ways of looking at the problem, let’s examine a hot 38°C (99°F) day in a hypothetical city (like Houston, Texas) and examine each question in turn.
1. How much more likely has climate change made a 38°C day?
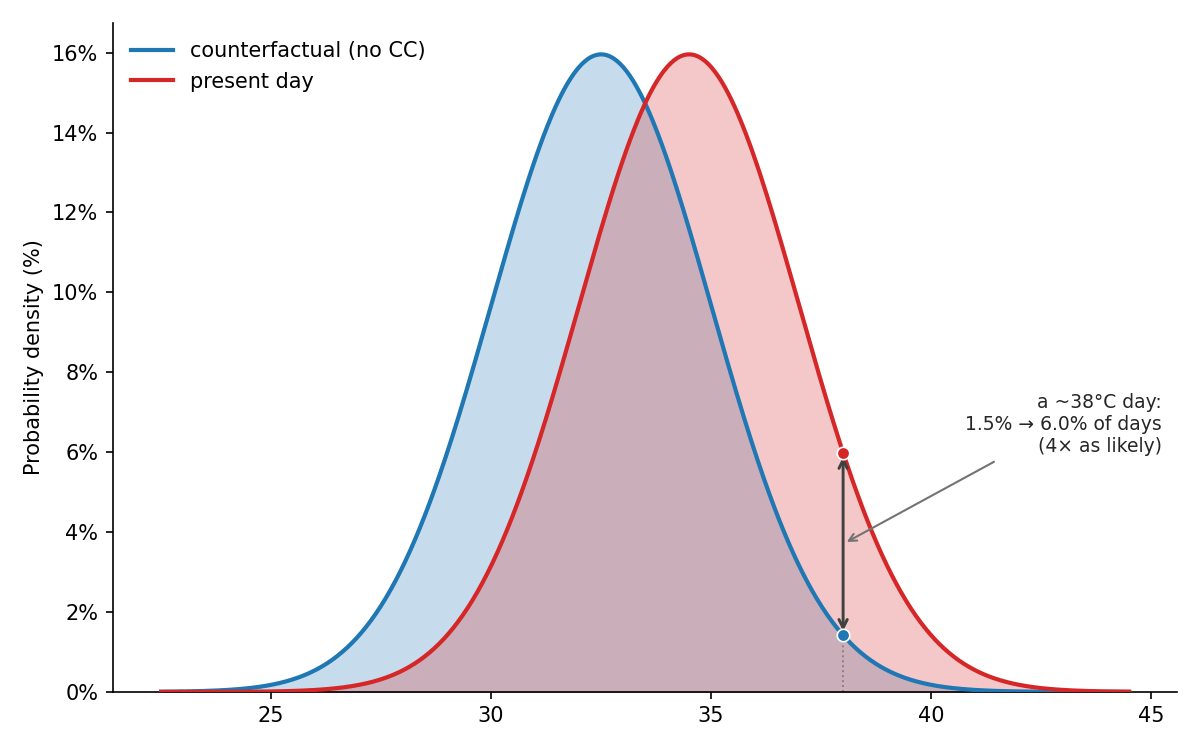
This figure sets up how scientists look at the problem. It shows two hypothetical distributions of daily temperature for the city. The red curve is the present-day distribution: the climate as it actually is today. The distributions tell you how often each temperature occurs in that world. For example, today’s temperature distribution peaks around 35°C with a value of 17%, meaning that 17% of days have temperatures around 35°C.
The blue curve is a counterfactual: the distribution that would occur in a world without climate change. For this hypothetical example, climate change has shifted the climate a few degrees toward warmer temperatures.
Given the two distributions, we can now answer the question of how much more likely a 38°C day is. In the counterfactual no-climate-change world, a 38°C day occurred on roughly 1.5% of days; in the present-day climate, it occurs on about 6% of days.
We define the relative risk to be the risk of the event in today’s climate divided by the risk in the counterfactual climate:
where Pa is the probability of the event in the world with climate change (6%) and Pc is the probability in the counterfactual world (1.5%). Thus, the relative risk in this example is 6%/1.5% = 4. We can therefore say that, “Climate change made this 38°C day four times as likely” or that, “The relative risk of a 38°C day is four.”
Because of the shape of the distributions, the relative risk increases with temperature. Using the same curves, a 42°C day occurs on 0.013% of days in the counterfactual world and 0.19% in the world with climate change, implying a relative risk of 15. This confirms that the hotter the day, the more the relative risk of that day has increased. In fact, we are approaching a world (if we’re not already there) with so much climate change that events occur that could not have occurred in the counterfactual world (Pc ≈ 0). For those events, the risk ratio is infinity.
Temperatures near average have a risk ratio around 1, meaning their probability isn’t changing much due to climate change. Below average temperatures (e.g., 27°C) have risk ratios less than one, indicating that they are occurring less often than in the counterfactual world.
2. How much did climate change warm this day?
This is a different way to ask the same question: how much hotter was the day because of climate change? To answer this, we look at the graph horizontally. We find the probability of a 38°C day on the present-day curve and trace it back to the same probability on the counterfactual curve.
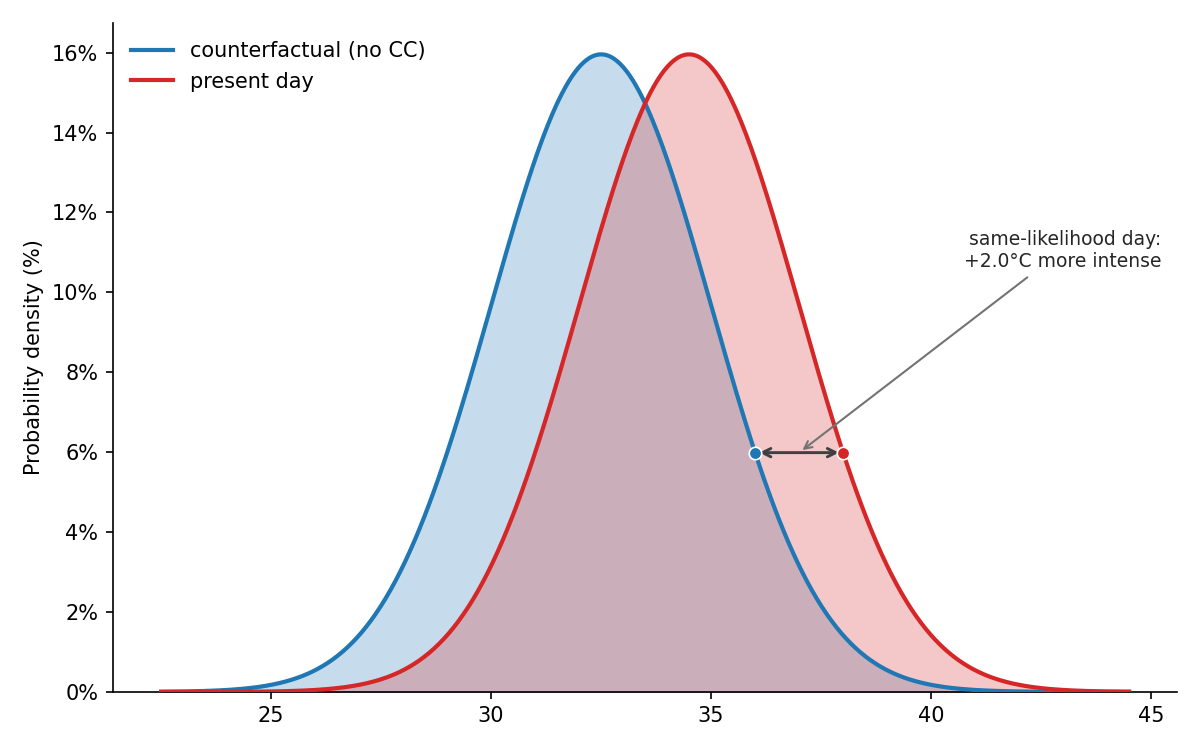
In this example, we find that the same probability for today’s 38°C corresponds to a temperature of 36°C in the counterfactual climate. In this case, we can say, “Climate change made this hot day 2°C warmer.”
While some economic actors (e.g., governments, insurers) may focus on probability, most impact evaluations are clearer when examined through magnitude changes. In other words, it may be of more practical use to know that climate change warmed this day by 2°C or increased total rainfall by 30% than knowing that climate change increased the probability by a factor of four.
Thus, we can express climate change’s contribution to this hypothetical 38°C day in two ways. We can say that 1) climate change made the event four times more likely, or that 2) climate change added 2°C to the temperature.
Determining the counterfactual world
As discussed in the last section, estimating the impact of climate change on a meteorological event requires assessing the distribution of those events in the present-day world and in a counterfactual world without climate change.
To establish the present-day distribution of climate events (red curves in the plots above), researchers rely primarily on a combination of real-world observational records and numerical climate-model simulations of the present-day climate. To estimate the counterfactual climate (blue curves), the world that would have existed had human activities not altered the climate system, scientists will often run these same climate models but with human influences removed (e.g., carbon dioxide and other climate forcers set at pre-industrial values).
Researchers can also use historical observations to estimate the counterfactual climate. In some cases, researchers can use observations from a time period when human influence on the climate was small, such as the late 19th or early 20th century. As an example, this is a plot of Houston’s daily maximum temperature in the 1970s and 2016-2025:
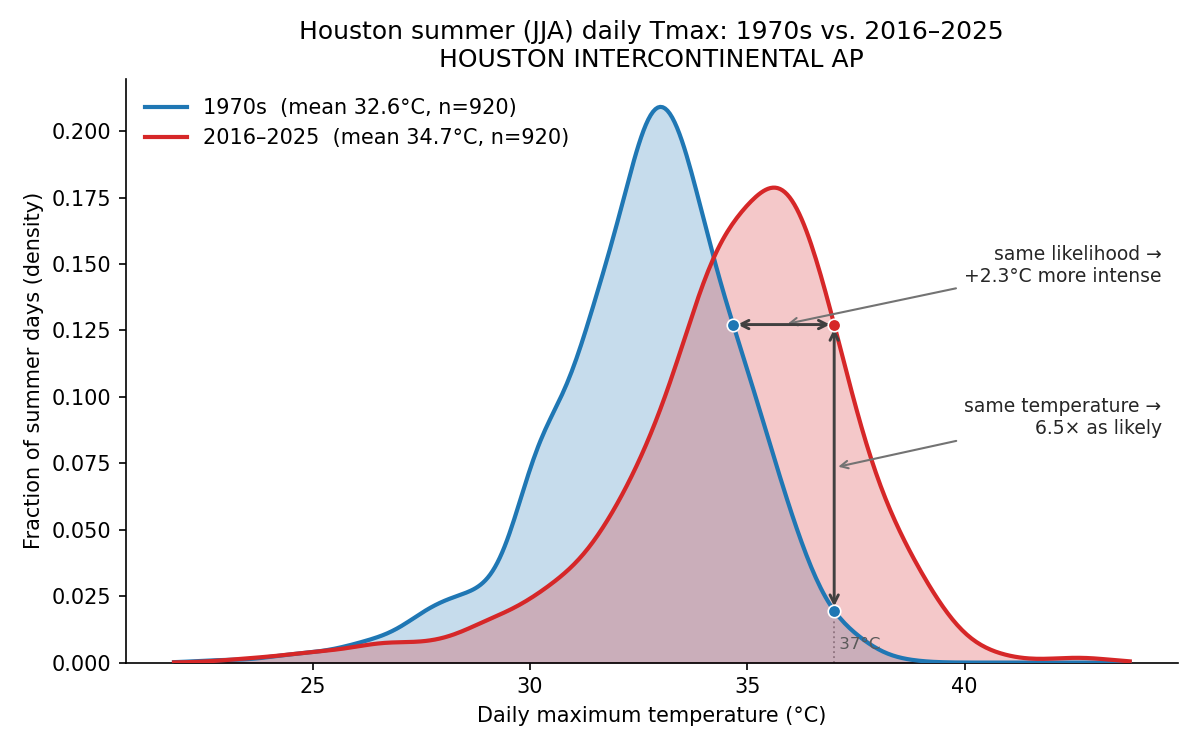
There is a clear shift in the climate between these two periods, much — but not necessarily all of it — due to climate change. This shift made a day with a maximum temperature of 37°C (99°F) about 6.5 times more likely (i.e., risk ratio = 6.5); alternatively, it increased the temperature of this day by 2.3°C (4.1°F).
Notably, in the 1970s, daily maximum temperatures above 40°C (104°F) never occurred in Houston, but they did occur in the 2016-2025 period. Such days would therefore be considered virtually impossible without climate change.
One thing to look out for: After every extreme event, fossil-fuel interests will take to social media to point out that a more severe event — e.g., more rain, higher winds, and higher temperatures — occurred in, e.g., 18XX (some year in the late 19th century). They use this to incorrectly imply that climate change therefore could not have influenced the event.
But that’s a logical error. If you look at the probability distributions from Houston, you’ll see that you could have had a 39°C day in the counterfactual 1970s world (it’s just very unlikely). But the existence of a 39°C day in the 1970s doesn’t contradict the conclusion that the 37°C day you just lived through was enhanced by climate change.
Traditional detection and attribution
There is another way scientists connect climate change to extreme events known as detection and attribution. This approach focuses on trends in some quantity — for example, the trend in the annual maximum 1-day precipitation amount, with units of mm/decade. This is different from extreme event attribution, which focuses on individual extreme weather events.
As a simple example, suppose we have an observational time series of the aforementioned maximum daily rainfall at a station in the U.S. This gives us one number each year: the maximum daily rainfall in 1950, the maximum daily rainfall in 1951, and so on:
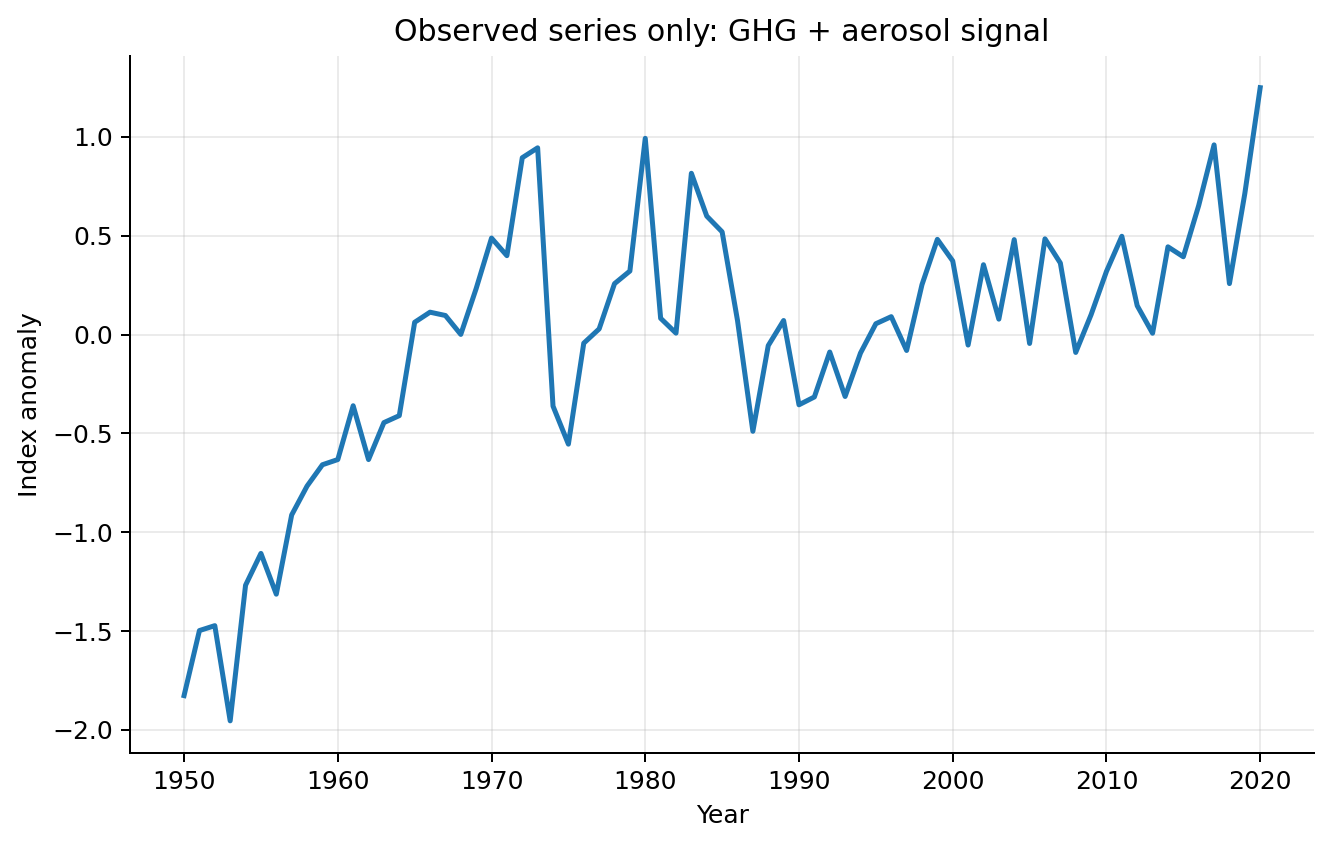
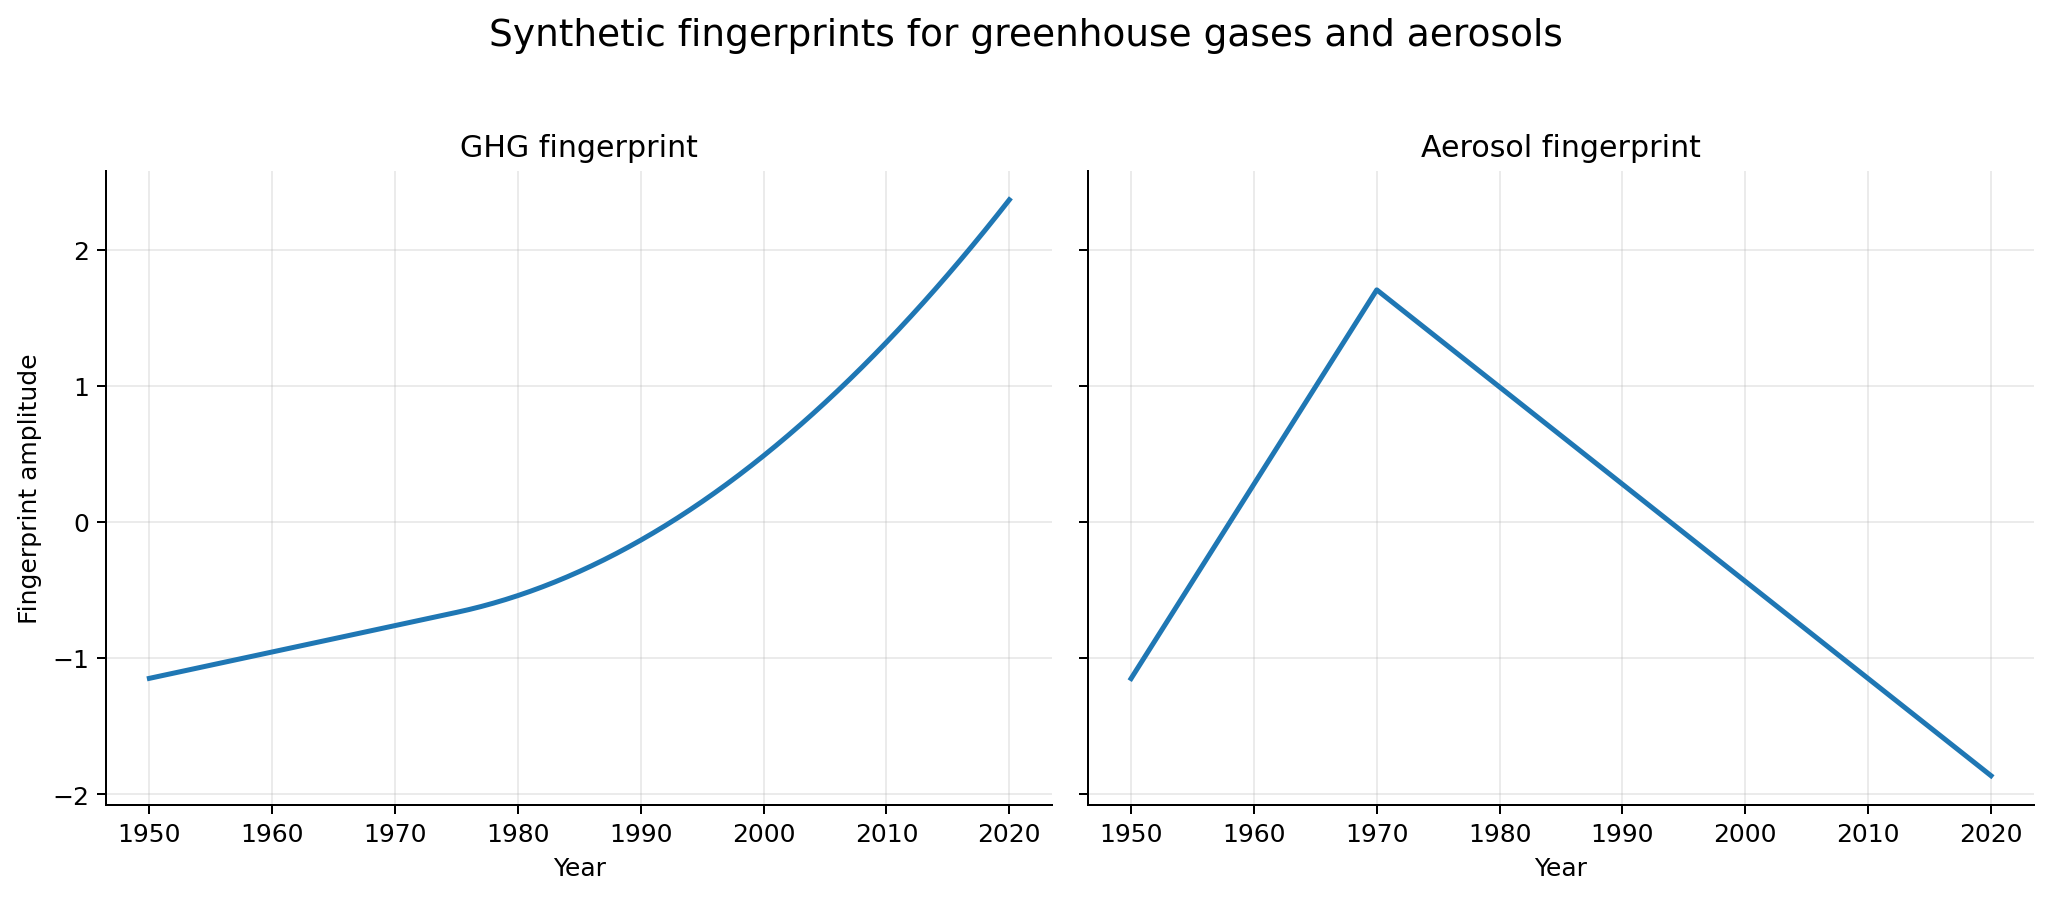
We want to know whether the variations in in this observed (synthetic) time series can be attributed to greenhouse gases from human activities, aerosols (basically air pollution and dust, this is partially due to human activities), or some combination of them. These different drivers have different trends over time: greenhouse gases have been steadily increasing, while aerosols in the U.S. increased until around 1970 and have declined since then.
The first step in detection and attribution is to run climate models to estimate the fingerprint of each process. To do this, scientists run climate models with just the increase in greenhouse gases, and then run the models again with just the changes in air pollution. These runs tell us what the observations would look like if just this forcing was present in the atmosphere.
We then compare the observed time series to the model fingerprints. A simple way to do this is with a regression model:
Here, obs(t) is the observed time series. G(t) is the greenhouse gas fingerprint timeseries, and A(t) is the aerosol fingerprint timeseries.
We then use regression techniques to estimate the coefficients bGHG and bAER, which tell us how much of each fingerprint is present in the observations. e is the residual, the part of the observations not explained by the fingerprints.
Here are the results:
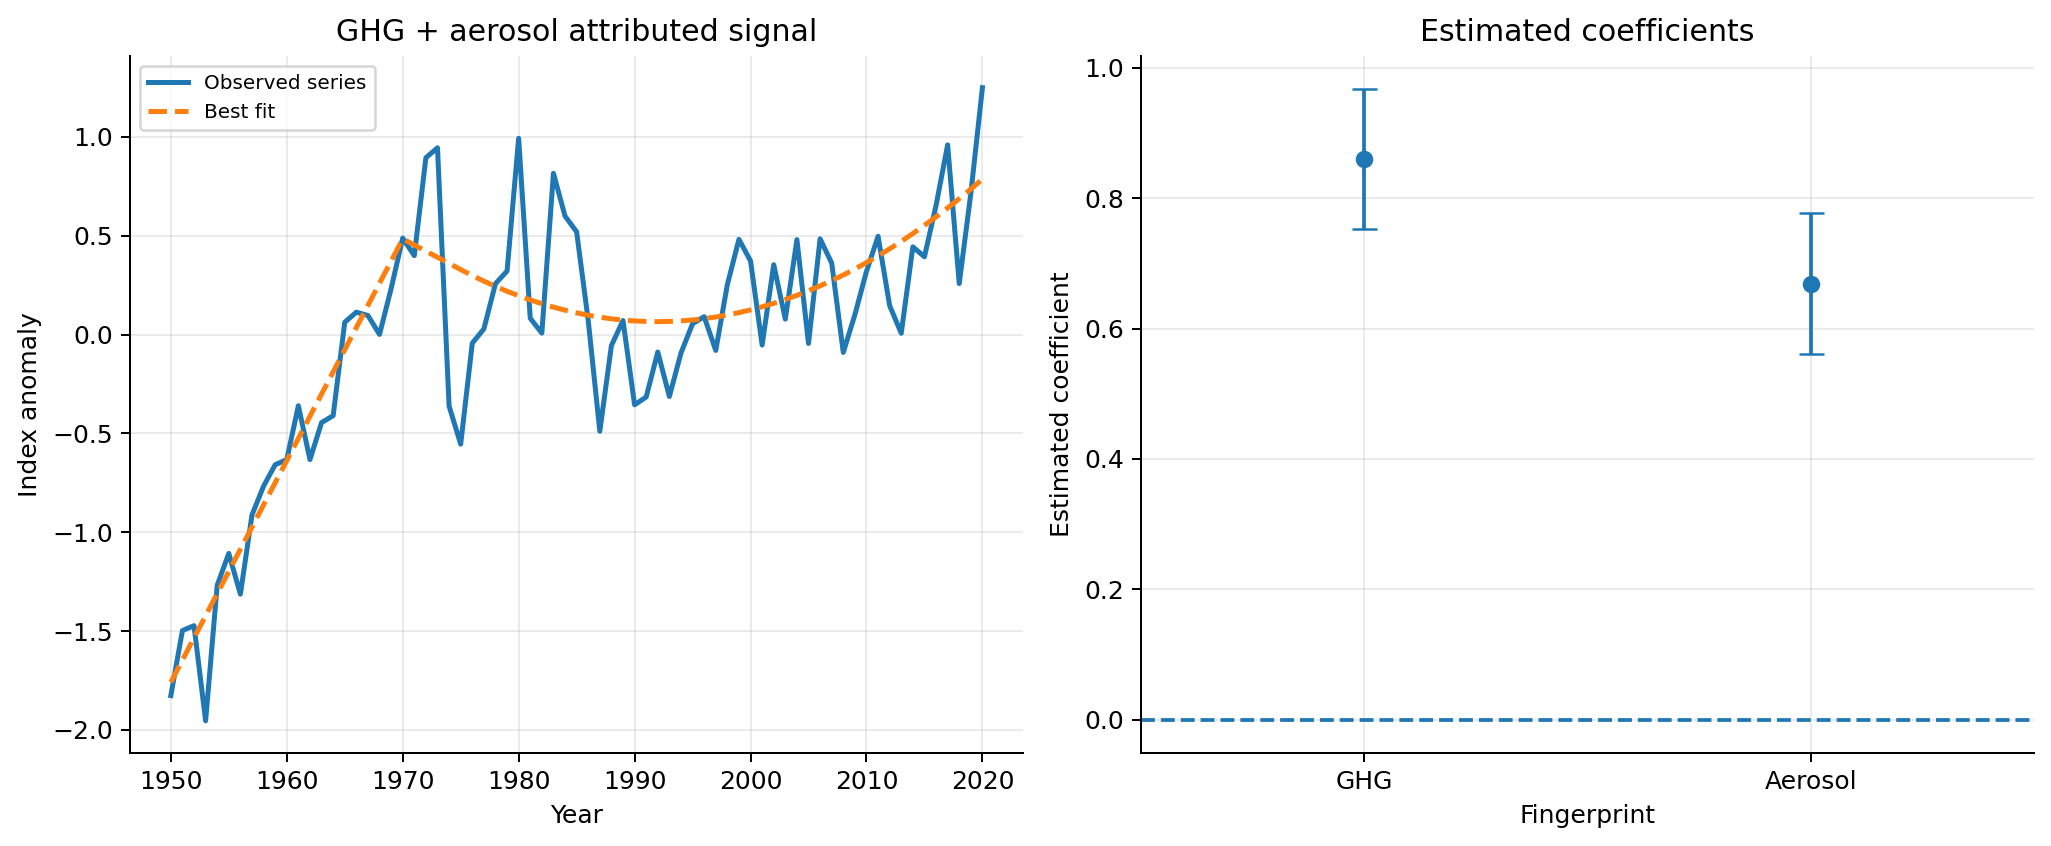
In the left panel, the blue line is the synthetic observations and the orange line is the fit:
where G(t) and A(t) are the fingerprints above. As you can see, we can closely fit the observations with the fingerprints for greenhouse gases and aerosols.
Next, we examine the estimated coefficients (bGHG and bAER) and their uncertainty ranges (right panel). If a coefficient is statistically different from zero, we say that fingerprint has been detected. That’s the case here — the uncertainty bars do not cross zero — so the fingerprints for greenhouse gases and aerosols are detected.
This is the basic logic of detection and attribution.
Importantly, detection and attribution does not allow us to link specific events (e.g., Hurricane Harvey) to climate change. Rather, it allows us to connect the trend in some type of extreme weather (hurricanes) to human activities.
If you want to play around with a simple demonstration that shows how this works, click here.
This is an extremely powerful technique that has laid the foundation for much of our understanding of how climate change is affecting extreme weather. Here are some key results:
Hot extremes and heatwaves: Humans are clearly making hot extremes more frequent and more intense through human-caused greenhouse gas emissions.
Heavy precipitation: Human influence, especially greenhouse gas emissions, is likely the main driver of the observed global-scale intensification of heavy precipitation over land.
Flash flooding due to extreme rainfall: Scientists have high confidence that stronger extreme precipitation leads to more frequent and larger surface-water and flash floods.
Drought: Scientists have medium confidence that human-caused climate change has increased drought1 in some regions.
Tropical cyclones: Scientists have medium confidence that human influence has contributed to extreme tropical cyclone rainfall. In addition, the global proportion of the strongest tropical cyclones has likely increased over the past four decades, a change that cannot be explained with natural factors alone.
Fire weather: Scientists have concluded with medium confidence that compound hot, dry, and windy conditions have become more likely in some regions.
Confidence in attribution studies
In reading the previous section, you saw that scientists have varying levels of confidence in the attribution statements. Some conclusions are termed likely or very likely, and confidence may be medium or high. How is this confidence determined?
The foundation of any attribution study is a solid physical understanding of why climate change would affect a particular type of event. If we can’t provide a mechanism, you really can’t believe an attribution study.
For many extreme events, the physics is well-understood and there is a clear connection between the climate and the severity of the events:
Heatwaves: Greenhouse gases trap heat, shifting the distribution of temperatures toward warmer values, thereby making extreme heat more probable.
Rainfall: The connection is the physical fact that a warmer atmosphere can hold more water vapor. This means that when a storm system develops, there is more available moisture to convert into rain, leading to more intense downpours.
Wildfires: Warmer temperatures produce a drier atmosphere, drying out vegetation and making it more flammable. Thus, wildfires are expected to be bigger and more intense in a warmer climate.
For other phenomena, the physics is murkier. For example, there is no robust theory explaining how the total number of tropical cyclones will change as the climate warms (tropical cyclone is the general term for storms known as hurricanes in the Atlantic, typhoons in the Pacific, and cyclones in the Indian Ocean). Right now, there are around 80 tropical cyclones per year around the planet, and we can’t explain why that’s the number. Why isn’t it 8? Or 800? We don’t know. Without such an understanding, we can’t really trust climate models’ counterfactual world for this.
But this doesn’t mean that we know nothing about tropical cyclones. There are strong physical arguments that tropical cyclones will get more intense (higher wind speeds) and rainier as the climate warms, which will cause more damage. As an example, several groups analyzed the impact of climate change on Hurricane Harvey’s enormous rainfall totals over Houston, Texas and they found that climate change increased rainfall by ~20%. The increase in wind speed means that we expect the fraction of tropical cyclones reaching the major storm category (cat 3-5) will increase as the climate warms, in general agreement with our observational record.
Once you have a physical mechanism, the other factors that determine confidence are things like:
How good is the observational record? For some things, like temperature, we have good observations going back to the 19th century. For others, like tropical cyclones, good observations are only available during the satellite era, i.e., since the 1970s. With a shorter dataset, your confidence in any attribution study will be lower.
How good are climate models at simulating the weather phenomenon? Most attribution studies require climate models to generate the various counterfactual worlds (the world without climate change). Climate models do a really good job with temperature, which is a large-scale atmospheric phenomenon. But they do a much poorer job with precipitation, which is a very small-scale process that models struggle with.
How many independent studies have confirmed an attribution statement? In science, the gold standard for a rigorous conclusion is that it has been multiply replicated by independent scientific groups. While any individual study might be flawed, the odds of a major error go down significantly if several groups have independently reached the same conclusion.
It is also worth noting that there may be times when detection and attribution studies fail but extreme event attribution studies can still identify a contribution of climate change to an extreme event. For example, high quality time series of some extreme events (e.g., tropical cyclones) may go back only a few decades, which may be too short for confident detection and attribution. Extreme event attribution approaches, which do not rely on long time series of observations, are nevertheless able to conclude that climate change is making specific hurricanes stronger.
Conclusion
The science of extreme event attribution has transformed our ability to discuss the impacts of climate change. We can now make statements about how climate change affected the likelihood and intensity of individual events as well as the trends in extreme events. This helps demonstrate that climate change is indeed increasing the ‘hazard’ component of climate risk.
As the science of extreme event attribution has developed, it has increasingly moved into the legal and public policy arenas. Fossil fuel interests are terrified that someone will use extreme event attribution science to sue them for their contribution to a natural disaster, or that policymakers will use extreme event attribution science to justify policies to restrict fossil-fuel use.
Because of this, the legitimacy of extreme event attribution is frequently contested by fossil-fuel interests. So don’t be surprised if you hear a lot of misinformation about extreme event attribution in the future. And don’t think that, just because people are criticizing these studies, that criticism is legitimate.
Note that the techniques described in this chapter deal with the effects of climate change on hazards. A new subfield, extreme event impact attribution connects climate change to the actual impacts (e.g., number of houses burned down in a wildfire, dollars of flood damage). This is an emerging area of research, and I expect that this is something we’re going to hear a lot more about in the future.
This is a draft of a section of my climate risk textbook (slightly edited & reformatted to make it appropriate for Substack). I’d very much like to identify errors now, so if you see any, please let me know in the comments.
I’d be grateful if you could hit the like button ❤️ below! It helps more people discover these ideas and lets me know what’s connecting with readers.
Different types of drought respond differently to climate change. In this case, we are talking about agricultural and ecological droughts.
This is an excellent chapter, thank you.
It seems to me that heat distribution - El Niño / La Niña - is warping the Northern Polar Vortex, causing a geographic shift resulting in distortions of where rain falls, or where tropical cyclones move. Is that too localized or too recent for models to attribute to Global Warming? That is, if 80 Cyclones per year is steady, but they shift in geography by a few hundred miles eastward in the north or westward in the south, due to weeks-long wobbles in the polar vortex, is that a calculable change?
Excellent writeup. Thank you.