
Climate risk explained
a chapter from my upcoming textbook

I am finalizing a textbook on climate risk and am posting chapters as I finish them. I’d previously posted a chapter about embedded energy; this post is an introductory chapter on climate risk.
Chapter 2: Climate risk
We saw in Chapter 1 that today’s college students will experience around 2°C of warming during their lifetime, unless more strenuous action is taken to reduce emissions of greenhouse gases. But I have not explained how this climate change affects humans and natural ecosystems that we care about. In this chapter, I will begin answering that question by introducing the concept of climate risk.
What is climate risk?
The IPCC defines risk in a somewhat elliptical way as:
The potential for adverse consequences for human or ecological systems, recognising the diversity of values and objectives associated with such systems. In the context of climate change, risks can arise from potential impacts of climate change as well as human responses to climate change. Relevant adverse consequences include those on lives, livelihoods, health and well-being, economic, social and cultural assets and investments, infrastructure, services (including ecosystem services), ecosystems and species.
Thus, the term climate risk refers to the range of challenges and potential harms that are created or intensified by climate change. This includes changes in the physical climate system (e.g., more intense rain), but it also reflects the extent to which these changes impact things we care about. A rain event by itself is not a climate risk, but one that falls on a city that is vulnerable to flooding is. In a future chapter, we’ll talk about transition risk, which is the economic and social risks of transitioning to climate-safe technology.
Climate risk is therefore best understood as the combination of three interconnected components: hazard, exposure, and vulnerability:
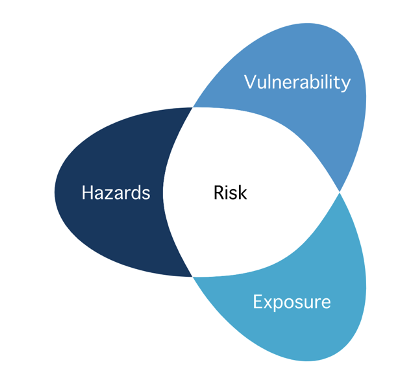
Hazard refers to climate-related physical events that may cause loss of life, injury, or damage to property, infrastructure, livelihoods, service provision, or natural ecosystems. These hazards include sudden events like hurricanes, floods, and wildfires, as well as slow-moving processes such as sea-level rise, drought, and shifts in precipitation patterns. The frequency, intensity, duration, and spatial extent of these hazards are all influenced by climate change, with many becoming more severe and destructive as global temperatures rise.
Exposure represents the presence of things we care about (e.g., people, infrastructure, natural ecosystems) in places that could be adversely affected by climate hazards. For example, coastal cities have exposure to hurricanes and sea-level rise, while Western U.S. cities will be exposed to combination of extreme heat, wildfires, and drought. Most places have exposure to some type of climate risk.
Vulnerability is a measure of how easily an exposed system can be harmed by climate hazards, and this is heavily influenced by social and economic factors. For example, poorer communities have fewer financial resources to develop robust infrastructure (like storm drainage or building sturdier structures) and fewer options to evacuate or relocate, less insurance coverage, and reduced access to healthcare after disasters. They are also often sited in worse places, like areas with poor drainage that richer communities don’t want to build on.
This creates an unfair situation where two neighborhoods might face the same hazard (e.g., a hurricane) but the wealthier area is less vulnerable and therefore sustains less damage and recovers quickly while the poorer, high vulnerability neighborhood suffers lasting harm. Vulnerability, in other words, is mostly a social issue.
Climate risk emerges from the interaction of these three components, often conceptualized as Risk = Hazard × Exposure × Vulnerability. This multiplicative relationship emphasizes that risk factors combine and amplify each other. When all three elements intensify simultaneously, the resulting risk can increase exponentially rather than linearly.
This formula also highlights that interventions addressing any single component can significantly reduce overall climate risk. Communities may have limited ability to directly reduce hazards in the short term but can effectively lower risk by reducing exposure and vulnerability through zoning restrictions or improved building standards, early warning systems, and social safety nets.
Let’s now examine each term individually.
Hazards
Temperature: With 100% confidence, we know that the Earth’s average temperature is rising. But most impacts do not come from shifts in the average temperatures; they come from changes in the extremes. This is bad news because we expect to see much larger (fractional) changes in extreme temperatures than in average temperatures.
To understand this, let me show you a probability distribution of daily average temperature for a fictional place:
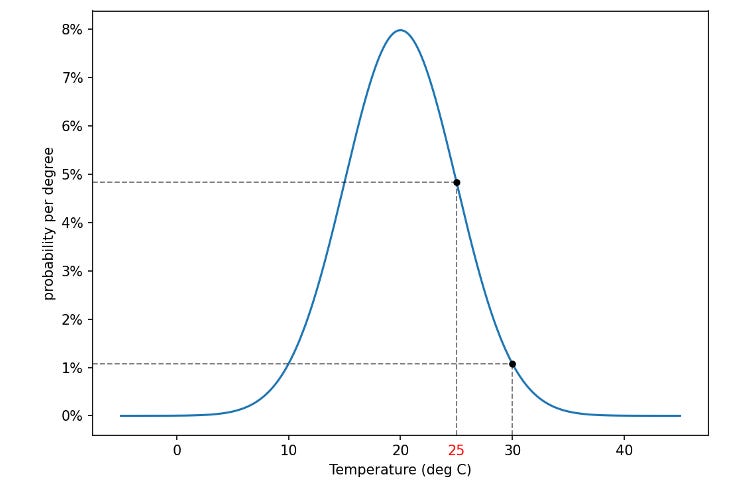
The y-axis value of each temperature shows the probability of that temperature occurring. For example, a daily average temperature of 25°C has a probability of about 5%1, while the probability of a 30°C day is about 1%.
Climate change shifts the probability distribution:
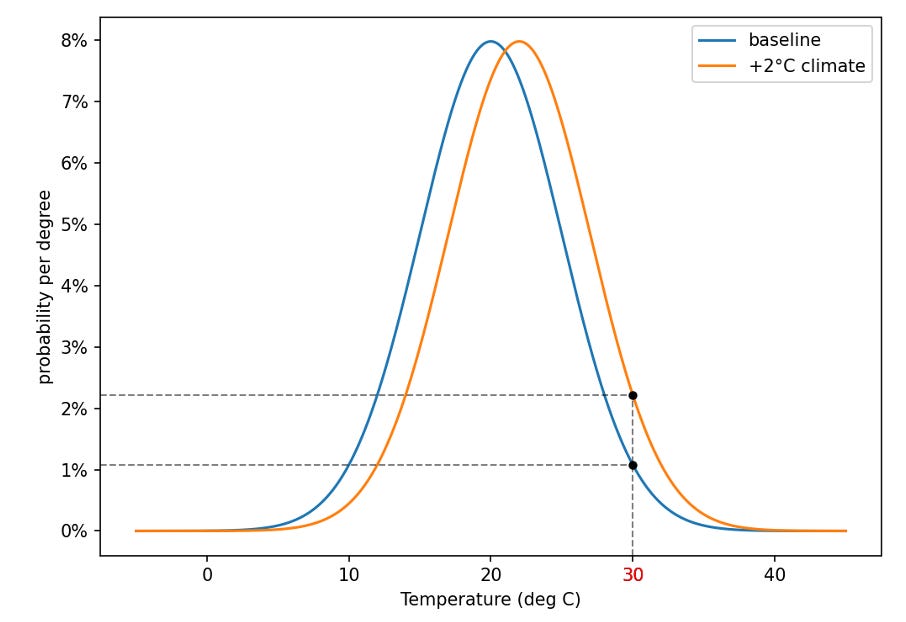
The blue line is the baseline climate, while the orange line is a climate that’s 2°C warmer in this location. The probability of the middle of the distribution — average days — doesn’t change much. The plot above shows that the probability of a 25°C day doesn’t change much.
But at the tails, where the extreme days lie, the probabilities change dramatically. A 30°C day will occur twice as frequently, from 1.1% of days to 2.2% of days. A 35°C day will occur three times as frequently. As the climate warms, the chance of an extremely hot day rises rapidly. With 4°C of local warming, the chance of a 35°C day is eight times larger.
Cold days will become less frequent. Days with an average temperature of 10°C, which occurred about 1% of the time in the base climate, essentially disappear with 4°C of local warming.
Precipitation: Warming also increases precipitation. The reason is straightforward physics: warmer air can hold more water vapor. The Clausius–Clapeyron relation tells us that for every 1°C of warming, the atmosphere’s water-holding capacity increases by about 7%. If the convergence of air into a storm remains the same, then the water vapor converging into a storm also increases as the climate warms. As the air rises and cools in the storm’s updraft, that extra water vapor condenses, producing more rain. In other words, with the same dynamics but a warmer background climate, storms wring out larger amounts of precipitation.
You can think of this as a probability shifting exercise, just as it was with temperature. As a result, moderate rainfall days change little, but the heaviest downpours grow much more intense. For example, here is a plot of how the amount of rain in the heaviest 1% rain days has increased:
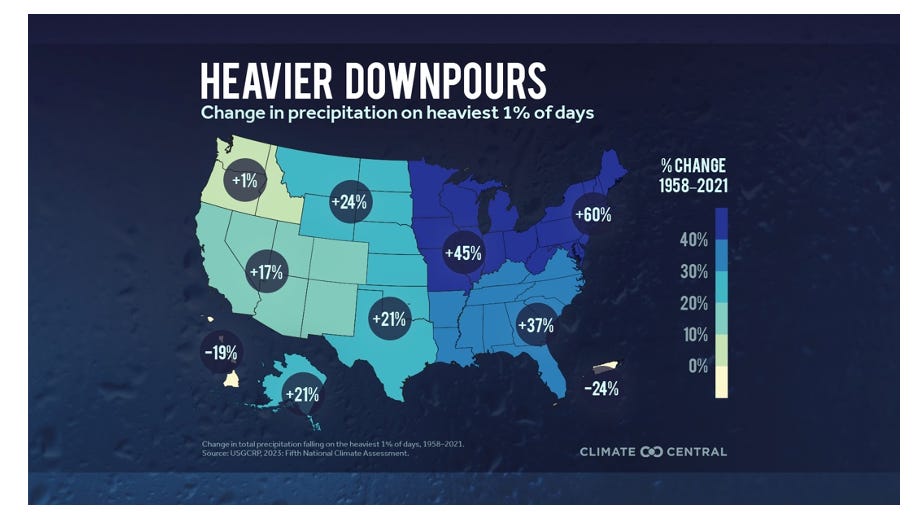
Because a larger share of rainfall will occur during the heaviest downpours, the impacts will often be negative. In an intense storm, soil can only absorb water so fast, so much of the rain runs off instead of soaking in. This runoff can overwhelm both natural drainage and built infrastructure, causing flooding.
If the most intense rain events increase faster than the mean — which we expect — then this also means longer dry intervals between storms. Combined with warmer temperatures — which increase the rate at which soils lose water through evaporation — this increases the likelihood of drought.
The result is what scientists call hydrologic whiplash: both wet and dry extremes become more common. Wet extremes bring flooding, erosion, and landslides. Dry extremes bring water shortages, stressed ecosystems, and crop losses. Dry periods also intensify heat, creating feedbacks that link these hazards together.
There are several other important changes in precipitation. Although global total rainfall is expected to increase, the increase will not be distributed evenly. Scientists often describe changes in precipitation as “wet gets wetter, dry gets drier,” meaning that regions that get a lot of rain today will tend to get more in the future, while places that are dry today will get drier in the future.
There will also be shifts in the form of precipitation. Less wintertime precipitation will fall as snow and more will fall as rain. This is more important than it might sound: When snow falls in winter, the water does not run off until the snow melts in spring. Rain, on the other hand, runs off immediately, so changing the form of precipitation changes the timing of runoff, increasing the availability of water in winter and early spring and decreasing it in late spring and summer. Given that humans have adapted to the present timing of runoff, changes will negatively impact human welfare.
Floods rank among the most damaging climate hazards. The fact that floods are also affected by human systems (e.g., development, dams, levees) makes global flood trends difficult to detect. Observations show no clear worldwide signal, though certain regions have experienced increases tied to both climate change and development choices. Even so, our confidence in how precipitation will change gives us good reasons to believe that floods will become more frequent and intense as the climate warms.
Sea-level rise is a 100%-certain impact of climate change for two reasons. First, as grounded ice melts, the meltwater runs into the ocean, increasing the total amount of water in the ocean and, therefore, sea level. Second, like most things, water expands when it warms, which also tends to raise sea level. Measurements confirm that sea levels have been rising as temperatures have gone up, and we can be certain that the seas will continue to rise for a very long time into the future.
The latest IPCC report predicts that sea level will rise 47 to 73 cm (19 to 29 inches) above 1995-2014 levels by 2100. While this might sound manageable, the danger lies in how it amplifies extreme sea-level events. Think of sea level rise as raising the baseline water level upon which storm surges, king tides, and other storm-driven extreme sea level events ride.
A coastal defense system designed to handle a 5-meter extreme sea level event works fine when a 4.9-m storm surge comes along, but it is inadequate when that same surge occurs on top of a 0.5-meter higher sea level. In other words, sea level rise can push flooding beyond critical thresholds, overwhelming drainage systems, breaching seawalls, and inundating areas previously considered safe.
Over thousands of years, predicted sea level rise is very large. Paleoclimate data tells us that we can (roughly) expect a few meters to a few tens of meters of sea-level rise for every 1°C of warming. The only good news is that this will take a very long time. Thus, the 1.3°C of warming we have already experienced means that we are committed to something in the neighborhood of 6-13 m (20-40 feet) of sea-level rise over the next few thousand years. This will irreversibly alter the shoreline of the planet, for a very long time.
For example, such sea level rise will erase Florida from the map. I know it’s tempting to consider that a net benefit of climate change, but realize that a lot of places we like will also flood. In the end, people alive in 5,000 years will almost certainly be living in a world with much higher sea levels and very different coastlines due entirely to decisions we make in the next few decades.
Ocean acidification is another 100% certain consequence of emissions of carbon dioxide to the atmosphere. This is the result of a simple chain of logic: 1) humans are dumping carbon dioxide into the atmosphere, 2) a significant fraction of this carbon dioxide is absorbed by the oceans where, in the liquid environment of the ocean, carbon dioxide is converted into carbonic acid.
Thus, as humans emit carbon dioxide, the oceans become more acidic. There’s no mystery or uncertainty in this process—we can observe that today’s surface waters are more acidic than they have been in the last two million years. This trend will persist as long as humans continue burning fossil fuels.
This can greatly affect ocean ecosystems. Making oceans more acidic reduces carbonate ions, which makes it harder for animals with shells and skeletons to build and maintain them. Eventually, the increased acidity can become deadly for them. While the acidity of the ocean has varied over geologic times and ecosystems have adjusted, the changes occurring now are extremely fast, so it is far from certain that natural evolutionary processes can buffer the impacts.
These changes in the climate will conspire to make many types of severe weather more hazardous. As an example, let’s consider tropical cyclones. These are called hurricanes if they form in the Atlantic, typhoons in the Northwest Pacific, and cyclones in Southwest Pacific or Indian Ocean. I’ll refer to them in this section as tropical cyclones, abbreviated TCs.
Let me explain why we are 100% certain that changes in the climate system are increasing the hazard from TCs:
1. Sea level
As described above, we are absolutely certain that sea level is rising because humans are heating the planet. As Prof. Adam Sobel said in Congressional testimony a few years ago: “The most certain way in which hurricane risk is increasing due to climate is that, because of sea level rise, coastal flooding due to hurricane storm surge is becoming worse. Storm surge occurs when the winds from a storm push the ocean onto the land. The total flooding is determined by the surge (the part produced by the wind), the tide, and the background average sea level. As sea level has risen … the flooding is exacerbated by that amount.”
2. Rainfall
Climate change will increase TC rainfall due to the same logic that tells us that rainfall is going to get more intense. It’s just simple physics.
3. Intensity
Basic physics tells us that TCs should get more intense as the climate warms. We cannot yet see a clear climate-related trend in the historical record, which is not that surprising given the fact that hurricanes are relatively rare events and high-quality data doesn’t go back that far. In fact, there is a trend in hurricanes getting more intense. And we can have high confidence that this trend will continue into the future.
4. Number of tropical cyclones
There may be some good news: possibly fewer TCs! Some climate models predict fewer TCs as the climate warms, although a larger fraction of those that occur will be intense category 3, 4, or 5 storms.
However, there’s a very large “but” associated with this prediction. The scientific community still lacks a comprehensive theory explaining what determines the annual global frequency of TCs. Each year, approximately 80 of these storms form across the world’s oceans, but we don’t know why nature settles on this number rather than 8 or 800.
This theoretical gap means our projections of TC numbers rely almost entirely on computer simulations of the climate, which struggle to reliably simulate small-scale, complex phenomena like TC formation. This should give us pause when considering their forecasts about future TC frequency. Regardless of how the number of storms change, though, please remember that, when TCs do form, they will be more hazardous than TCs that are forming today.
This discussion has only touched on a few of the ways that TCs are getting more hazardous. There are other possible changes, such as the tracks of TCs moving to higher latitudes, more frequent rapid intensification, or the slowdown of TC translation speed, all of which can also increase TC hazard.
A second example is wildfire. Wildfires are a natural part of many ecosystems, but climate change is altering both their frequency and severity. The connection to hydrologic whiplash is especially important. Wet periods encourage rapid plant growth. When those wet conditions are followed by long dry periods, the accumulated biomass dries out and becomes highly flammable. Climate change is therefore loading landscapes with more fuel and then priming it to burn.
Once fires ignite, the fires spread more quickly and burn more intensely. Large, severe fires not only destroy forests and homes, they also leave soils bare and water-repellent. This makes post-fire flooding and landslides far more likely when rains return, compounding the impacts.
A clear example of this cycle comes from California. In some years, unusually wet winters produce lush vegetation across hillsides. When those plants dry out in the state’s long, hot summers, they provide abundant fuel for fires. In turn, megafires such as those in 2017, 2018, and 2020 have left burn scars that later flooded during heavy rains. This sequence — rapid growth, severe fire, then destructive flooding — shows how warming-driven extremes can reinforce one another.
Wildfire smoke is another hazard. It can spread thousands of miles, reducing air quality and causing respiratory and cardiovascular health problems. In many regions, smoke exposure already represents one of the largest climate-related health burdens, killing 24,000 people per year in the U.S.
Exposure
After hazard, the next factor in climate risk is exposure. Over the past century, humanity has dramatically increased its exposure to climate-related hazards through population growth and increasing wealth, leading to massive infrastructure development in vulnerable locations. This expansion into hazardous regions represents the biggest driver of our growing climate risk in many regions.
Coastal zones illustrate this problem most vividly. The allure of oceanfront property, maritime commerce, and tourism has driven a concentration of people and infrastructure on the coast, precisely where severe storms and sea level rise pose significant threats. For example, here is a photo of Miami Beach from early in the 20th and 21st centuries:
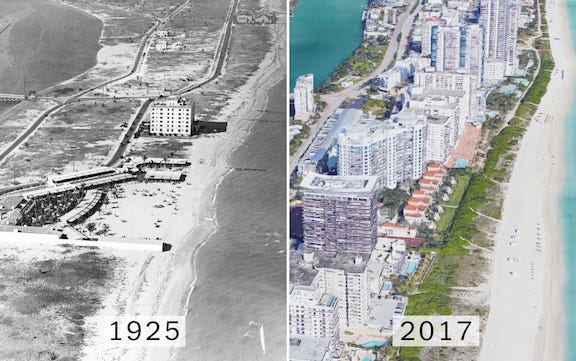
This shows the enormous build-out in areas that are susceptible to many different types of hazard.
Similarly concerning is the expansion of housing into what ecologists call the “wildland-urban interface” (WUI)—the transition zone between wilderness and human development. Throughout the American West, Australia, Mediterranean Europe, and other fire-prone regions, residential development has pushed deeper into forested areas that naturally experience periodic wildfires.
The attraction of these woodland settings is understandable. They offer privacy, natural beauty, and escape from urban congestion. However, this migration pattern has effectively moved millions of people directly into the bullseye of the worsening climate hazard of wildfire, causing exposure to skyrocket.
Vulnerability
Vulnerability is a measure of the susceptibility of communities, infrastructure, and other human and natural systems to be damaged when exposed to climate hazards. While hurricanes, floods, and wildfires might seem like equal-opportunity disasters, their impacts are dramatically uneven, often following existing social inequalities. The most vulnerable segments of society — the elderly, the poor, those with chronic health conditions, and marginalized communities — frequently bear a disproportionate burden of climate impacts.
As an example, here is a photo of a city in Florida after a hurricane came ashore:
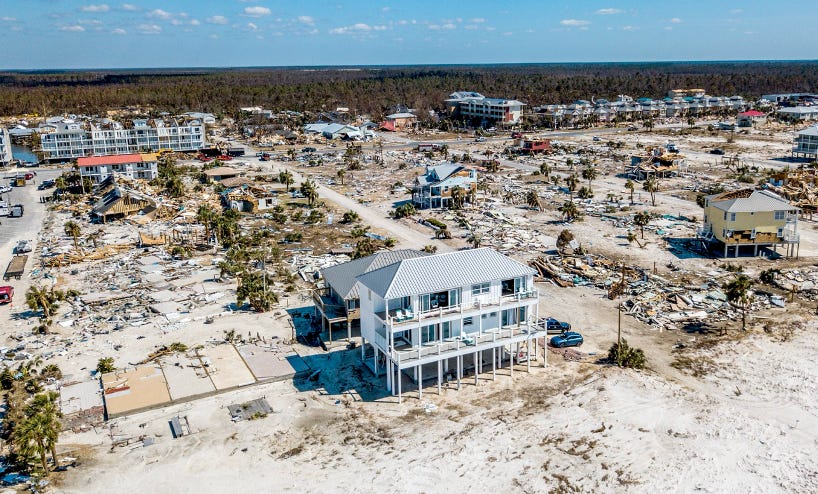
Most of the houses were wiped off their foundations, but the house in the foreground is basically unaffected. From the NY Times article that the photo came from:
Dr. Lackey said he and Mr. King, who jointly own the Mexico Beach house, did not even refer to the minimum wind resistance required in Bay County. They built the sand palace to withstand 250 mile-an-hour winds.
The house was fashioned from poured concrete, reinforced by steel cables and rebar, with additional concrete bolstering the corners of the house. The space under the roof was minimized so that wind could not sneak in underneath and lift it off. The home’s elevation, on high pilings, was meant to keep it above the surge of seawater that usually accompanies powerful hurricanes.
This demonstrates one of the key truths in climate risk: With enough money, you can engineer yourself out of most climate impacts.
Hurricane Katrina’s devastating impacts on New Orleans’ lower-income neighborhoods compared to wealthier areas shows this clearly. The Lower Ninth Ward, a predominantly Black, lower-income community, suffered catastrophic flooding, with water depths reaching 12 feet in some areas, destroying nearly every structure. Many of the residents who perished in the storm lacked the means to evacuate (e.g., private vehicles, limited financial resources) and had nowhere to go even if they could evacuate. Those who survived often had inadequate insurance coverage to fund recovery.
By contrast, wealthier neighborhoods like the French Quarter experienced significantly less flooding due to their higher elevation, stronger housing construction, and better flood infrastructure. Their residents typically had greater access to transportation, financial resources to evacuate preemptively, and robust insurance policies to facilitate recovery.
The disparity extended into the recovery phase: several years after Katrina, affluent areas had largely been rebuilt, while the Lower Ninth Ward still contained vacant lots and abandoned buildings. This pattern exemplifies how socioeconomic factors — including income, race, housing quality, transportation access, and political influence — transform the same hazard and exposure into vastly different lived experiences, with these differences persisting for generations.
This uneven distribution of climate impacts across society reveals something profound about our climate crisis: it’s not merely an environmental challenge but a complex socio-ecological problem where social structures determine who suffers first and worst.
Non-linearity
Beyond wealth, another crucial factor shaping vulnerability is non-linearity. If climate impacts were linear, each additional increment of warming — say, another 0.1°C — would produce the same increment of damage. Things would slowly get worse, and over several decades, the accumulated damages would become enormous. This linear model has dominated much of our thinking about climate change: a gradual, predictable process where impacts scale proportionally with warming.
But that’s not how it works. Rather, things are fine until they’re not. For example, this figure shows a schematic of how increasing rainfall can impact an individual:
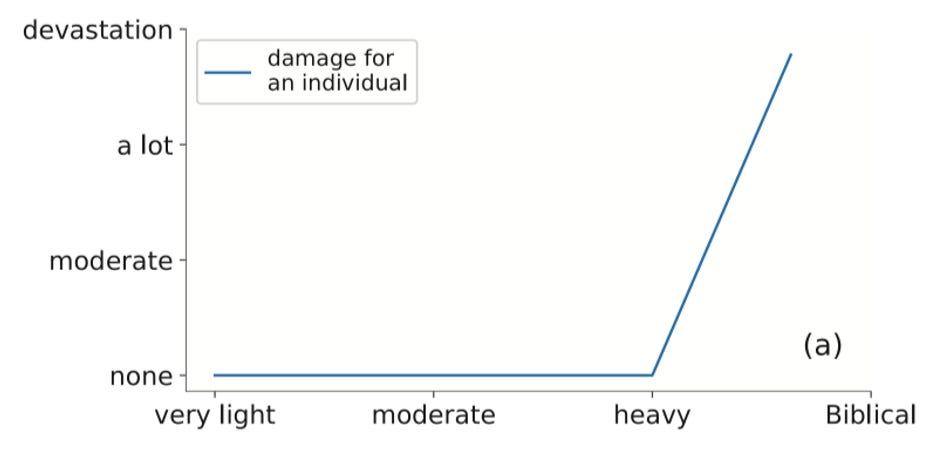
At low and moderate rates, rainfall does no damage because existing infrastructure is built to handle it. The point where damage begins (beyond “heavy” rainfall) is a threshold, and it is largely an engineered one. Society has chosen how much rainfall its drainage systems, levees, and buildings can handle, often based on the climate of the past. Beyond that threshold, damage rises rapidly: You go from zero damage if floodwater stops half an inch below your front door to tens of thousands of dollars if the water rises one more inch and flows inside.
To put everything together, here are vulnerability curves for extreme winds for two regions in the Philippines:
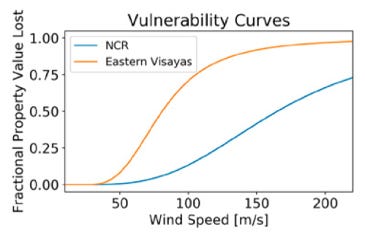
The National Capital Region (NCR) contains Manila and is the most populated, developed, and urbanized area in the Philippines. It has strong infrastructure and high socioeconomic resilience. Eastern Visayas is a less affluent, predominantly rural region characterized by weaker building construction, greater vulnerability to high winds, and significantly lower capacity to cope with disaster-related losses. As a result, at every wind speed, the richer region (NCR) shows less damage.
The plot also shows the non-linearity of vulnerability: zero damage at low wind speeds, then rapidly increasing when wind speeds pass a threshold.
Climate change and impacts
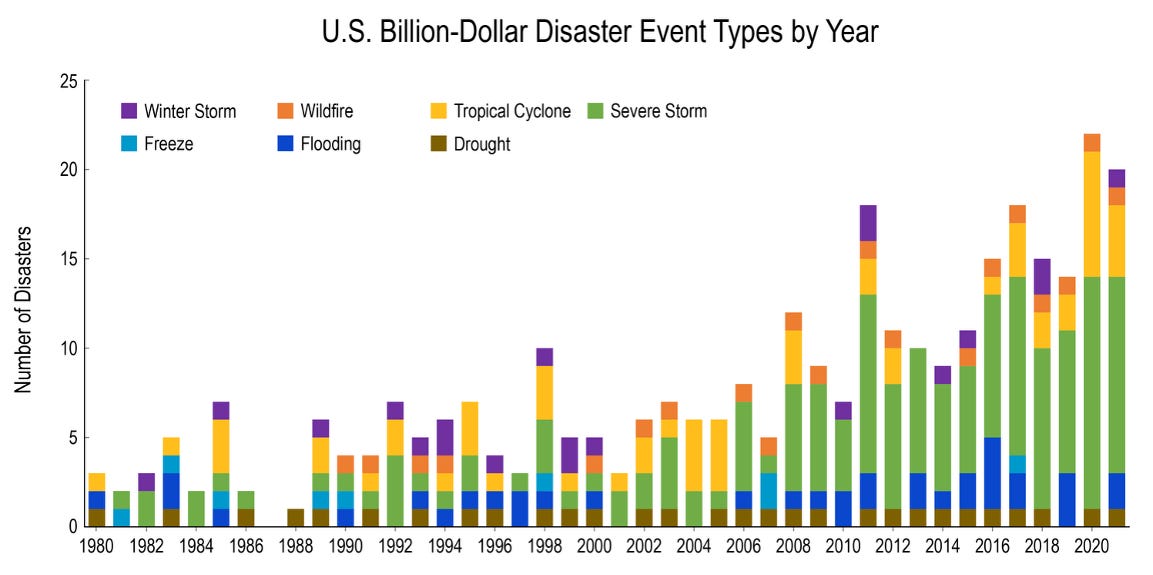
You may have seen a graphic of billion-dollar disasters in the U.S. over time:
Given that climate risk is the combination of these three factors: hazard, exposure, and vulnerability, we would like to decompose the trend in billion dollar disasters into trends in these underlying factors.
We know that most of this trend is driven by exposure: more people, who are richer, living in places where hazards hit (e.g., near the water, in the wildland-urban interface). This by itself is responsible for a large part of the increase in climate-related disasters.
We can also be confident that climate hazards are increasing in frequency and intensity and this is contributing to the trend. But, at the same time, vulnerability is declining. For example, after Hurricane Andrew devastated South Florida in 1992, the state adopted hurricane safety standards that mandated more resilient construction.
This included requiring impact-resistant windows or shutters, banning particle board in coastal areas, and reinforcing roofs and walls with stronger connections and concrete supports. Miami-Dade and Broward counties were designated as High-Velocity Hurricane Zones, with even stricter wind-load requirements. The building code has been updated regularly to reflect advances in engineering and storm science, and research after subsequent hurricanes has shown that homes built under the post-Andrew code sustained significantly less damage than older structures.
In the aftermath of Hurricane Harvey in 2017, Houston and Harris County moved to tighten flood-related building regulations: they shifted from using the 100-year floodplain to the 500-year standard and required new structures in those zones to be built at least two feet above that. Alongside code changes, a $2.5 billion bond referendum passed in 2018 funded flood control projects such as detention basins and bayou improvements.
There are limits to vulnerability reductions, however. For example, after Hurricane Ike made a near-miss on Houston in 2008, Texas began planning for a seawall to protect Galveston Bay and the Houston Ship Channel. Such a structure would be extremely expensive ($30-$60B) and no one seems willing to pay for it. So the project has been in a holding pattern for nearly two decades. We’ll talk about this in more detail in chapter X.
Putting this all together, the rising toll of climate-related disasters can be clearly understood through the changes in its core components. Exposure is increasing as people move to high-risk areas. Simultaneously, climate change is intensifying the frequency and severity of hazards. Counteracting these trends is reduced vulnerability, such as the updated building codes.
This is a draft of a section of my climate risk textbook (slightly edited & reformatted to make it appropriate for Substack). I’d very much like to identify errors now, so if you see any, please let me know in the comments.
I’d be grateful if you could hit the like button ❤️ below! It helps more people discover these ideas and lets me know what’s connecting with readers.
Technically, this the probability of a daily average temperature between 4.5°C and 5.5°C.
Interesting stuff although you might want to adapt the title slightly. I read it hoping to discover a smart way to explain risk multipliers, and a good run-down on probability in lay language. I really haven't found anything that gives people a clear idea of what on earth all these IPCC socio-economic scenarios are about and how they combine with climatological predictions. My lay attempt to cut through people's disinterest is to ask whether they know why people are scared of lions but not climate change. Always hits the mark, but doesn't actually say much - a lion in savanna:
is visible (there it is!)
has historical precedence (it ate your brother last week!)
is immediate (there is the lion - act now or be killed!)
has direct impact (the lion is going to eat you!)
has simple causality (the lion is going to eat you and you are going to be dead!)
is caused by an enemy (the lion!)
I think Daniel Kahneman was right - humans are perfectly adapted to ignore climate change.
Both clear and comprehensive, good work!
For those reading these comments, I'd like to note that I've described the historical development of ideas about impacts in perhaps excessive detail at https://history.aip.org/climate/impacts.htm
... 2025 version, the 2026 annual update will be posted in a few weeks.