

Jim Hansen and I have spent much of this year making seemingly opposite predictions about where 2026 will end up in the global temperature record books. He has argued since the spring that 2026 will be the warmest year on record; I have made the case that it is more likely than not to end up in second place. And in a recent post he framed our disagreement in memorably equine terms:
Based on this scientific evidence, we expect that when the horse race comes down the stretch, in November and December of this year, we will be riding a thoroughbred, a strong young horse, and Zeke will be atop a fading old nag.
For the record, I am the fading old nag in this metaphor. I have been called worse.
But here is the fun part: when the race comes down the final stretch at the end of 2026, there is a good chance we will both be declared winners. Hansen’s prediction is about NASA’s GISTEMP record specifically. Mine is about the average across the major surface temperature datasets. And when I run my own forecast model separately on each of six datasets, it gives GISTEMP a ~65% chance of a new 2026 record even as the multi-dataset average only has a ~32% chance and is likely to come in second place.
First, where my forecast stands. Back in December I projected 2026 at 1.41C (1.27C to 1.55C) above preindustrial levels, and in early June I revised that up to 1.46C (1.36C to 1.59C) as forecast models converged on a doozy of an El Niño developing in the latter half of the year. Hansen, via the Washington Post, cited my June estimate of a 26.6% chance that 2026 sets a new record.
That number has continued to creep up. With observations through June and the latest El Niño forecast ensemble, my current central estimate for 2026 is 1.50C (1.44C to 1.57C) above the 1850-1900 baseline in the average of six surface temperature datasets.1 That translates into a ~32% chance that 2026 beats 2024’s record, a ~66% chance it comes in second, and almost no chance (<2%) it falls to third or below. The figure below shows where those projections sit against the observational record.
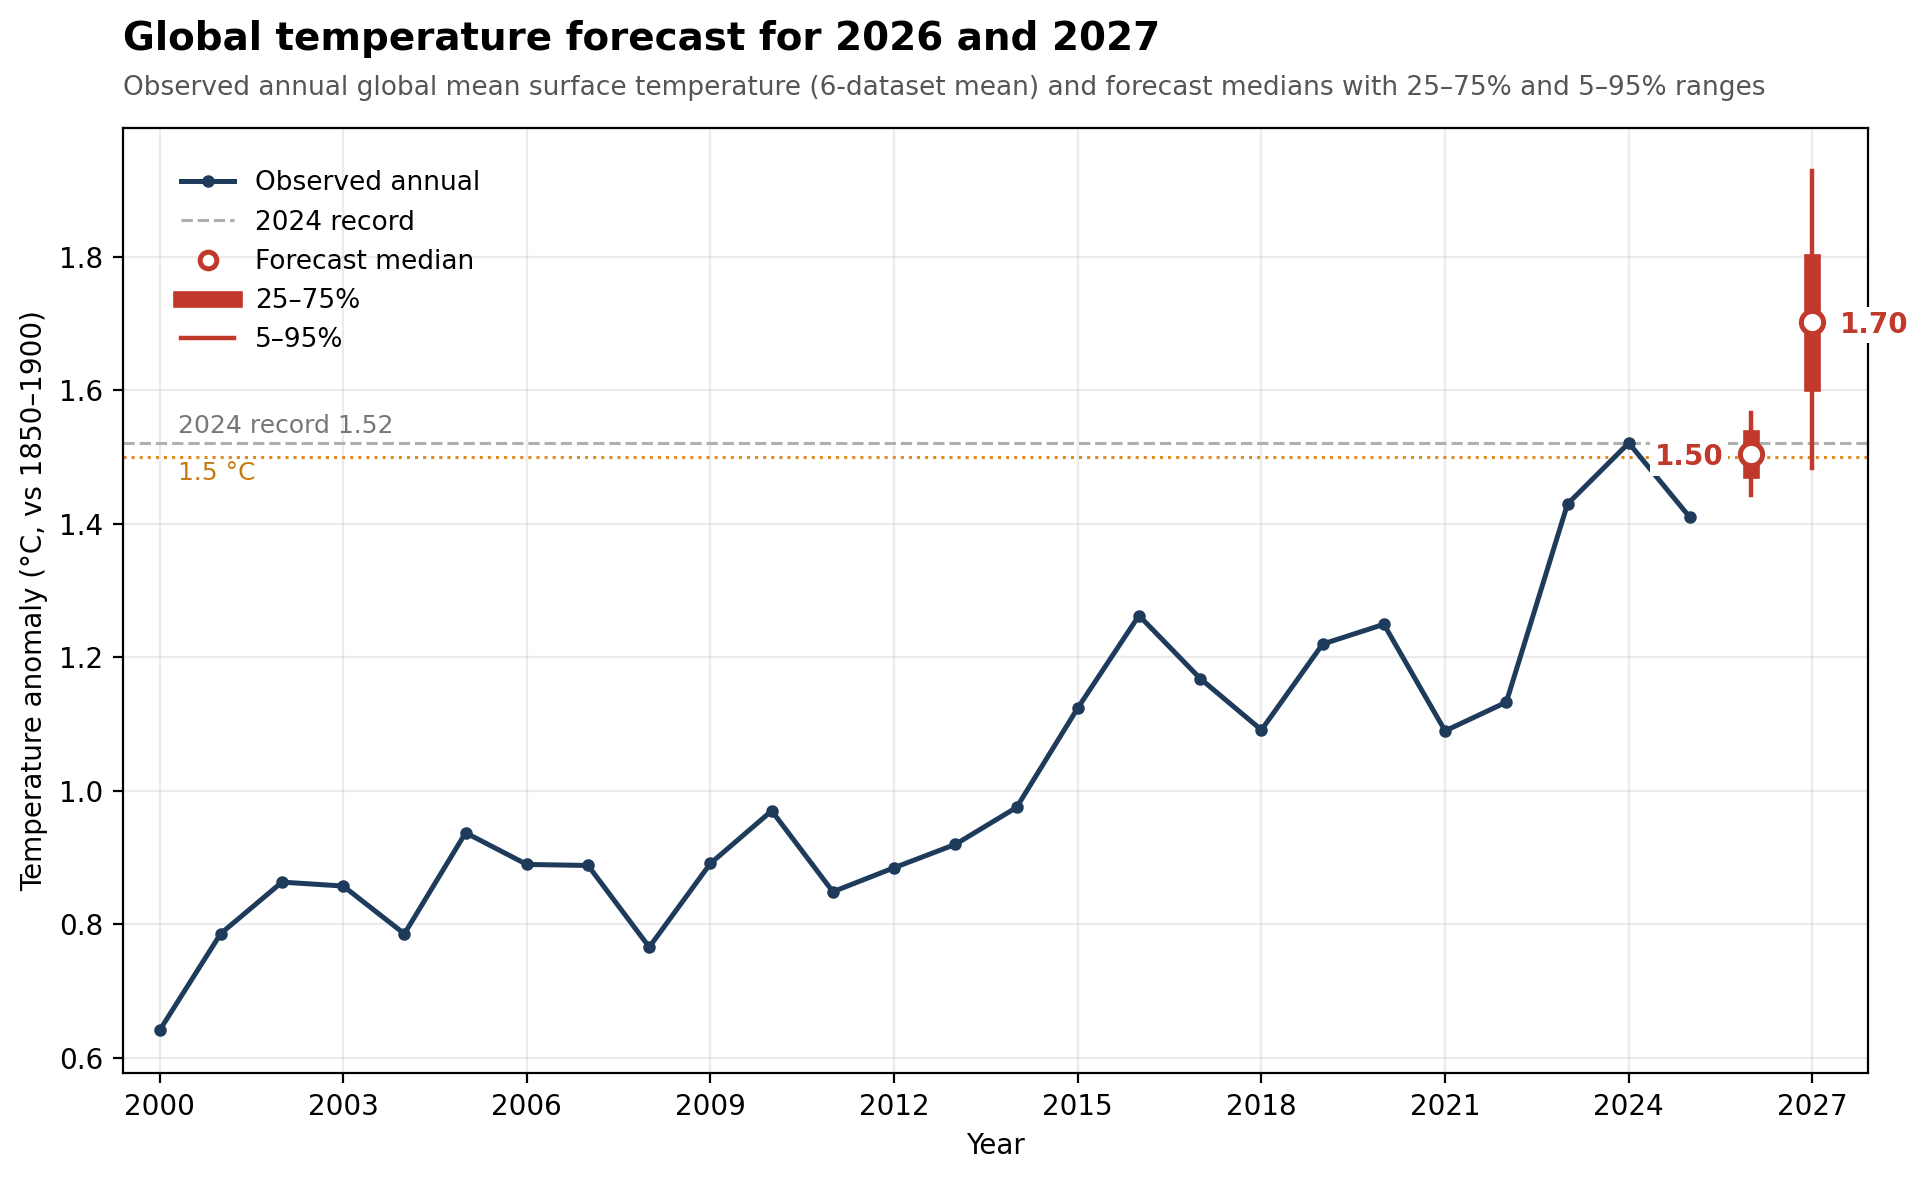
Here we see 2026 sitting just below the 2024 record line, with 2027 well above it. So the horse race (to continue the metaphor) is drifting in Hansen’s direction, though still short of the finish line. In the average of all the groups reporting global surface temperatures, second warmest remains my central call for 2026.
It is worth being clear about why my odds keep rising, because it is not that 2026 has been running unexpectedly hot. Year-to-date temperatures have actually drifted slightly down since March (a January-June mean of 1.39C, versus 1.41C for January-March). What changed is the El Niño forecast. To show this, I reran my forecast as it would have looked with each month’s information: that month’s multi-model El Niño plume plus observations through that month.
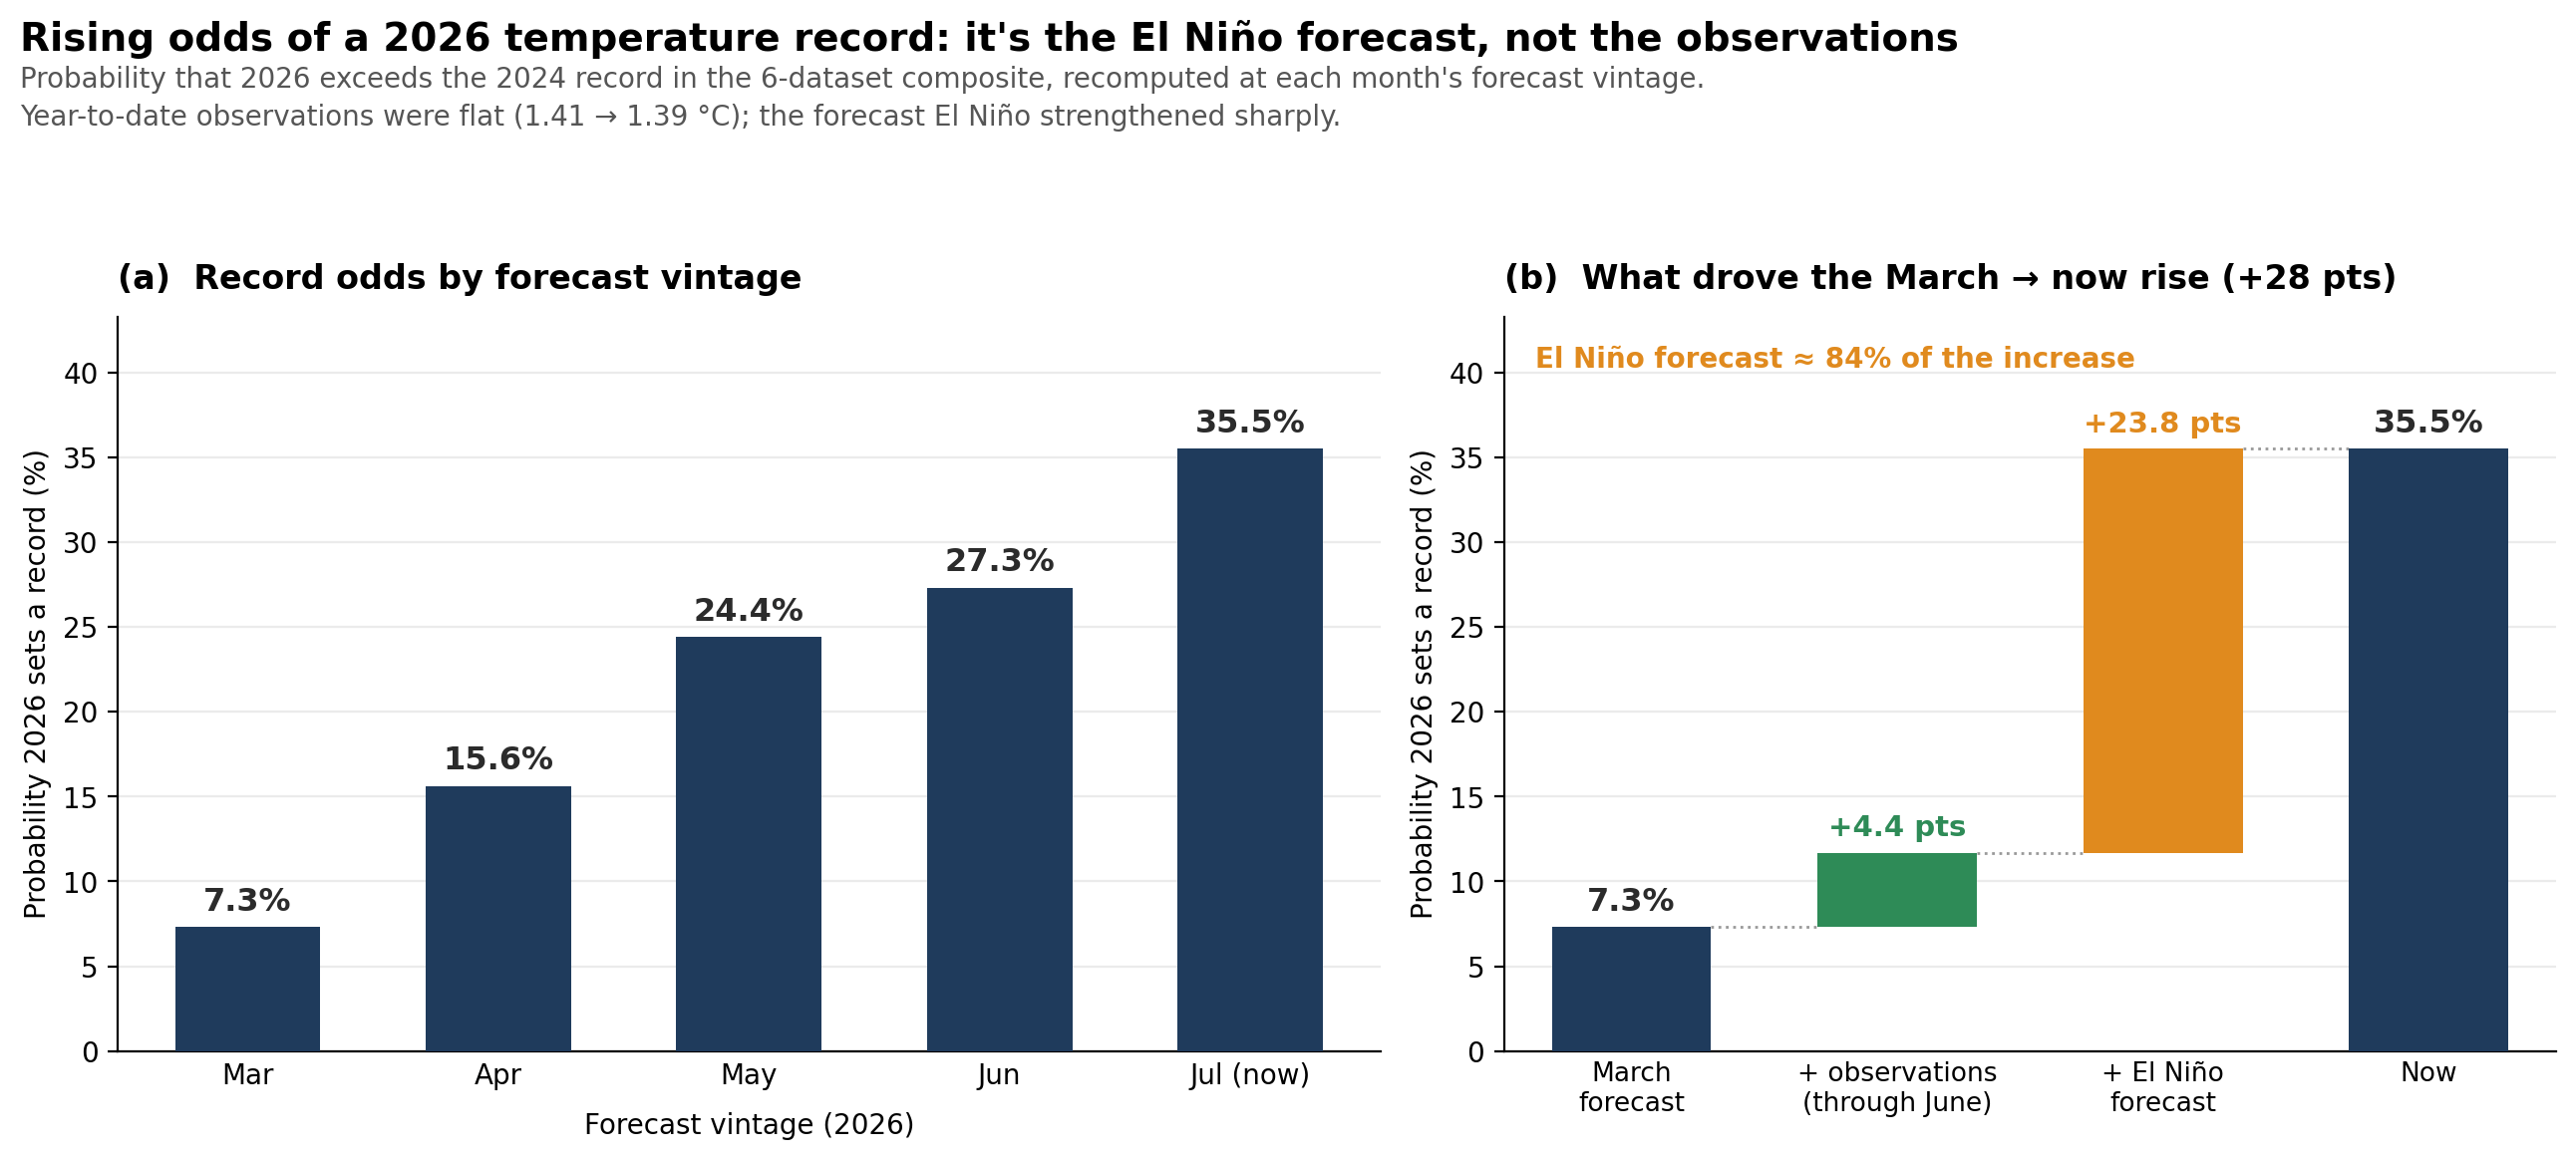
The odds of a 2026 record in the composite have risen from ~7% at the March vintage to ~35% now,2 and the decomposition on the right shows that the strengthening El Niño forecast accounts for ~84% of that rise; incoming observations contributed just over 4 points. In other words, my drift toward Hansen’s position is not the 2026 observations through June being particularly extraordinary. It is the ENSO models converging on an unprecedentedly large event. If that El Niño underdelivers, these odds will sag back down. If it holds, the odds will likely hold as well. But it seems unlikely (I hope!) that we see continued strengthening of the El Niño forecast beyond what already would blow past the prior record by a “truly mind-numbing margin”.
But “the warmest year on record” is not a single number that nature hands us; it depends on whose record you check. Hansen’s prediction is specifically about GISTEMP. So a natural question is: what does my model say if I fit it to each dataset individually, using each dataset’s own 2024 record as the bar to clear? The figure below shows the result for six datasets: the four traditional surface station products (GISTEMP, HadCRUT5, NOAA GlobalTemp, and Berkeley Earth) and two reanalysis products (Copernicus/ERA5 and JRA-3Q).
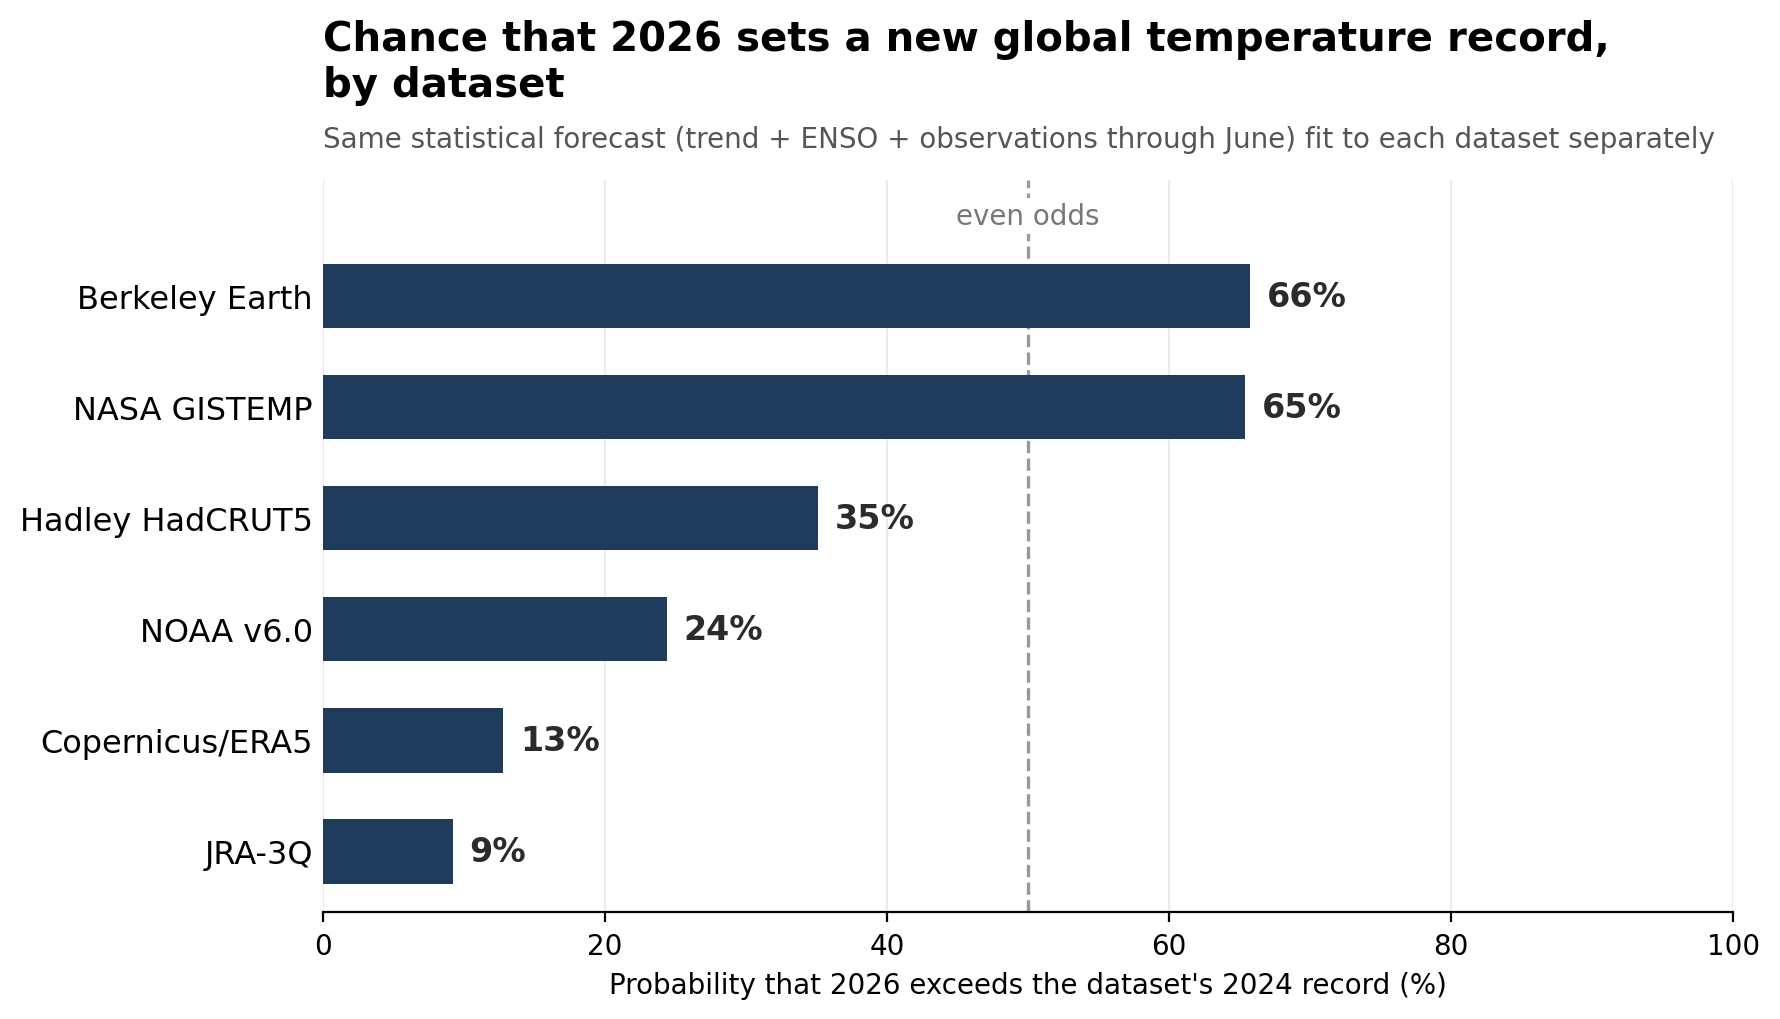
The same model, fed the same El Niño forecast, gives 2026 a ~65% chance of a record in GISTEMP and a ~66% chance in Berkeley Earth,3 but only ~35% in HadCRUT5, ~24% in NOAA, ~13% in ERA5, and ~9% in JRA-3Q. Conveniently, the average across the six (~35%) lands nearly on the blended estimate (32%), which is a reassuring consistency check.
Why the spread? It is not that the datasets disagree much about how warm 2026 will be; the projections are quite similar. They disagree about how high the bar is. The reanalysis products (ERA5 and JRA-3Q) ran exceptionally hot during the 2023-2024 event, so their 2024 records sit further above their long-term trend lines and are harder to beat. GISTEMP’s 2026 median projection sits ~0.02C above its 2024 record, while ERA5’s sits ~0.05C below its own and JRA-3Q’s ~0.07C below. When the margin is a few hundredths of a degree, structural differences between datasets could end up deciding the race.
So Hansen predicting a GISTEMP record and me predicting second warmest in the multi-dataset average are, oddly, compatible bets. If 2026 sets a record in GISTEMP but not in the dataset average (or in ERA5), expect a flurry of confused headlines in January as people try and explain how its the warmest or second warmest year depending on what dataset you look at.
I should concede the larger point plainly: Hansen made this call earlier and more confidently than I did, and the odds have moved steadily his way since. If 2026 ends up warmest across the board, he won outright, and a 32% chance is the kind of thing that happens all the time. I’d also gently note that a probabilistic forecast of “second warmest, with a one-in-three chance of a record” is a difficult thing to lose spectacularly.
What our agreement on 2026 does not settle is the more consequential disagreement about why. Hansen’s forecast rests on a specific physical story: his argument for a climate sensitivity of 4-5C per doubled CO2, a large forcing boost from falling aerosols, and a warming rate that has roughly doubled.4 My forecast is simpler: it just relies on the long-term trend, the state of ENSO, and the year-to-date observations and ends up in more or less the same place. When a statistical model based on the historical trend and an El Niño forecast lands on essentially the same 2027 number as Hansen (more on that in a moment), it tells you that a single warm year, or even two, cannot distinguish between “very rapid acceleration driven by aerosols and high sensitivity” and “the trend and more modest acceleration plus a very strong El Niño.” That debate will be settled by energy balance observations and the post-El-Niño years, not by whether 2026 clears 2024 by 0.03C in one dataset.
And on 2027 there will be no horse race at all: my model puts the odds of a new record next year at ~91%. Here I should give Hansen his due on a second count. Back in December he was already predicting a ~1.7C 2027, at a time when my own central estimate was 1.57C. Seven months and many rounds of strengthening El Niño forecasts later, my regression has drifted up to 1.70C (1.48C to 1.93C): essentially the number he wrote down at the start.
Ultimately both probabilistic forecasts and confident predictions can be validated by the same outcome, and the interesting scientific disagreement (how fast is warming accelerating, and why) will outlive whatever the December photo finish shows. Either way we are in for quite a wild climate ride in both the latter half of 2026 and 2027 due to a combination of accelerating warming and a super El Niño event.
The blended forecast uses the average of GISTEMP, HadCRUT5, NOAA GlobalTemp, Berkeley Earth, JRA-3Q, and ERA5, each rebaselined to 1850-1900 using its own pre-1900 offset. The model regresses annual temperature on the year, the prior year’s anomaly, observed and forecast ENSO conditions, the year-to-date anomaly, and the latest monthly value, trained on 1950-2025 excluding major volcanic years, with 10,000 Monte Carlo draws sampling both regression uncertainty and a ~650-member multi-model El Niño forecast ensemble. The headline numbers use a relative (RONI-style) ENSO index; using the raw ONI instead gives a slightly warmer 1.51C and a 37% record chance, because the forecast El Niño is strong enough to sit beyond the range of the historical ONI training data.
This figure only uses 13 of the 14 El Niño models in the live ensemble as the 14th (SINTEX-F) was only added to the tracker in June and cannot be used for the retrospective calculations, which is why it puts today’s odds at ~35% rather than the headline ~32%.
Its worth noting that my odds for Berkeley Earth are notably higher than those provided (~12%) in the official Berkeley Earth update. This is largely due to my statistical model including the ENSO predictions for the remainder of the year which does not improve the fit much for most years (start-of-year ENSO conditions tend to be a much stronger predictor) but does matter in the rare years where strong El Nino events are forming like 1997, 2015, 2023, and 2026.
Its worth noting that Hansen’s estimate of ECS is well within our very likely uncertainty range of 2C to 5C per doubling CO2 in the IPCC AR6. And there has been some compelling evidence in recent years that ECS might be higher, though I’d personally give a central estimate closer to 3.5C than Hansen’s ~4.5C, as well as a new preprint suggesting forcing from the 2020 IMO low sulfur shipping fuel regulations may end up somewhere between Hansen’s high and my low-end estimate.
There is much going on that is not fully clear.
I wrote the following as part of a draft paper in mid April:
Global warming progresses apace: Earth’s energy imbalance and global ocean heat content continue to increase
Earth’s energy imbalance reached its highest level, with the planet’s climate system accumulating heat primarily in the oceans. Driven by rising greenhouse gas emissions, the Earth currently retains more solar energy than it radiates back into space, with approximately 90% of this excess heat being absorbed by the global ocean. In 2025, global upper 2000-meter ocean heat content reached its highest level on record, with annual records being broken for nine consecutive years (2017–2025). The changes in clouds represent a strong positive feedback driven by changes in the atmospheric circulation.
Earth’s energy imbalance (EEI) is a fundamental metric of global Earth system change, quantifying the cumulative impact of natural and anthropogenic radiative forcings and feedbacks. Estimates of EEI change are obtained through satellite radiometric observations at the top of the atmosphere (TOA), while the quantification of EEI absolute magnitude is facilitated through heat inventory analysis. Globally, about 90% of heat uptake occurs as an increase in ocean heat content (OHC) (Cheng et al. 2022; Pan et al. 2026a), but there is no direct relationship locally. Suggestions have been made that the EEI heating is accelerating (Merchant et al 2025; Allan and Merchant 2025), along with sea surface temperatures (Foster and Ramstorf 2026) and OHC over the past four decades, but with much less evidence since about 2005 (Pan et al. 2026). Natural variability, including El Niño-Southern Oscillation (ENSO), complicate the climate change signal (Miyamoto et al. 2026) and many studies have not adequately accounted for such effects. Nevertheless, heating increases are occurring but driven mostly by changes in clouds and the atmosphere and ocean circulation (Trenberth et al. 2025; Allan and Merchant 2025; Tselioudis et al. 2025) in ways not fully understood.
Land is warming much faster than the oceans at the surface. In between the EEI at the TOA and the surface is the atmosphere and all the weather dynamics, so that changes in the atmospheric circulation and energy and water transports play a major role in influencing clouds and surface heat and water exchanges (fluxes) and ultimately OHC changes (Trenberth et al. 2025). Changes in atmospheric winds also alter ocean currents which further affect the atmosphere through changes in SSTs. Ocean heat transports are one consequence that contribute to the major differences between EEI and the OHC response, and can be deduced as a residual (Trenberth et al. 2005, Pan et al. 2026b). The latter show that ocean meridional heat transport follows ONI (ENSO) by 4 months, highlighting the role of natural variability also (Merchant et al. 2025; Tsuchida et al. 2026).
Because the ocean stores more than 90% of the excess energy associated with EEI, OHC provides one of the most robust measures of long-term climate change. Global OHC reached a new record high in 2025, marking the ninth consecutive record year, and the mean ocean warming rate increased markedly from pre-2005 values (Pan et al., 2026; Bao et al., 2026). This warming has become increasingly widespread, with about one-third of the global ocean ranking among its historical top three warmest states in 2025. Long-term warming extends from the surface into the deep ocean, although the magnitude of warming varies by depth and region. Strongest OHC warming has occurred in a distinctive zonal pattern near 30 to 45 latitude in both hemispheres (Trenberth et al. 2025). This spatially uneven warming suggests that regional OHC changes are shaped not only by net sea surface heat fluxes, including radiation, but also by oceanic heat transport, which redistributes heat across basins and latitudes and is influenced by climate variability such as ENSO (Pan et al., 2026b).
Global climate change arises from forcings external to the Earth system, and the primary forcing recognized is from human influences on the composition of the atmosphere. Burning of fossil fuels has led to over 50% increase in carbon dioxide in the atmosphere since pre-industrial times, and rates of increase have continued to grow through 2025. Increases in methane and nitrous oxide continue and are also caused by human activities. Changes in pollution (atmospheric aerosols) have complicated direct effects involving heating in some layers from carbonaceous aerosols but more generally cooling such as from increased sulfate particles. Several assessments indicate that effects of aerosol changes are mostly fairly minor. However, indirect effects on clouds are also profound.
As well as direct forcings, there are multiple feedbacks. Radiative cooling is a strong negative feedback. Increases in atmospheric water vapor, another greenhouse gas but short-lived, amplify warming, and a warming atmosphere can hold about 7% more water vapor per C temperature increase, as governed by the Clausius-Clapeyron equation. Loss of snow and ice also provide positive feedbacks through changes in albedo. Changes in clouds and cloud properties, in part from indirect effect of atmospheric aerosols, have been fraught.
Over the past few years, the global average surface temperature has increased more than expected, and in some cases has led to claims of acceleration of global warming (Foster & Rahmstorf 2026). It has been shown in a number of studies that this relates to how clouds have changed (Loeb et al 2025; Mauritsen et al. 2025; Merchant et al. 2025; Ceppi et al. 2026). Key changes include a reduction in overall cloud cover (specifically low-level reflective clouds), clouds moving to higher altitudes, and storm tracks shifting poleward, allowing more sunlight to reach the surface (Tselioudis et al. 2025; Trenberth et al. 2025). This has led to an increase in absorbed solar radiation (ASR), even as outgoing longwave radiation (OLR) has increased in association with higher temperatures.
It is not fully clear how much of the pronounced changes in atmospheric circulation and clouds is a response to forced climate change, as models forced with observed sea surface temperatures have tropical expansion rates that vary widely because of internal atmospheric variability (Miyamoto et al. 2026). Indeed, high temperatures in 2023 and 2024 are associated with a strong El Niño event, and global warming has been associated with jumps to new levels with such events (Trenberth 2015; Tsuchida et al 2026). However, as atmospheric reanalyses and global climate models do not replicate observed clouds and precipitation very well, this attribution remains a very important research question (Landsberg and Barnes 2026; Park and Soden, 2025; Allan and Merchant, 2025…)
Indeed, with human-induced climate change, more water vapor and heating strengthens convection making it taller and narrower, and broadens the subsidence regions in the subtropics and extratropics, thereby opening the “iris” of the planet (Lindzen et al. 2001). This is directly related to the observed changes in atmospheric circulation. Lindzen et al. claimed this was a negative feedback because it permits more radiation from the warmer lower atmosphere and surface to escape to space, and hence OLR would increase. However, fewer clouds also increase absorbed solar radiation (Trenberth & Fasullo 2009; Tselioudis et al. 2025), a factor not accounted for in Lindzen’s analysis, and the net result is a pronounced positive feedback. It remains a challenge for climate models and atmospheric reanalyses to simulate these observed changes.
In the end, for me , it's record-schmecord. It's somehow entertaining, yes, but the bottom line is: the whole thing is becoming somewhat uncomfortably fast.
Slightly OT: cloud simulation has been the achilles heel of earth models until now - the biggest source of uncertainty. The discussion around lower albedo, faster warming is largely centered around clouds. Better modelling would be invaluable here. So, as a suggestion, I would really love to see a post about AR7 models and progress in cloud simulation.