
The Strongest El Niño Ever
With all the July runs in, dynamical models give a ~90% chance of a record-setting event

I’m generally pretty measured in how I discuss climate data. There has been only one time in recent years when I was truly shocked: when global temperatures came in for September 2023 at a full 0.5C warmer than any prior September on record.1 Once until today, that is. With the July runs now in from 667 ensemble members across 14 different seasonal forecast models, it looks like this year’s El Niño is not only very likely to be the strongest event since reliable records began – it may end up the strongest by a truly mind-blowing margin.
The multi-model median for the event’s peak (measured as detrended sea surface temperature anomalies in the Niño 3.4 region of the tropical Pacific) currently stands at 3.6C, roughly 0.8C hotter than the prior record of 2.75C set in 2015-16. For context, the gap between the strongest and the fifth strongest El Niño of the past 150 years is only about 0.5C. The models are forecasting something outside the envelope of anything we have ever observed.
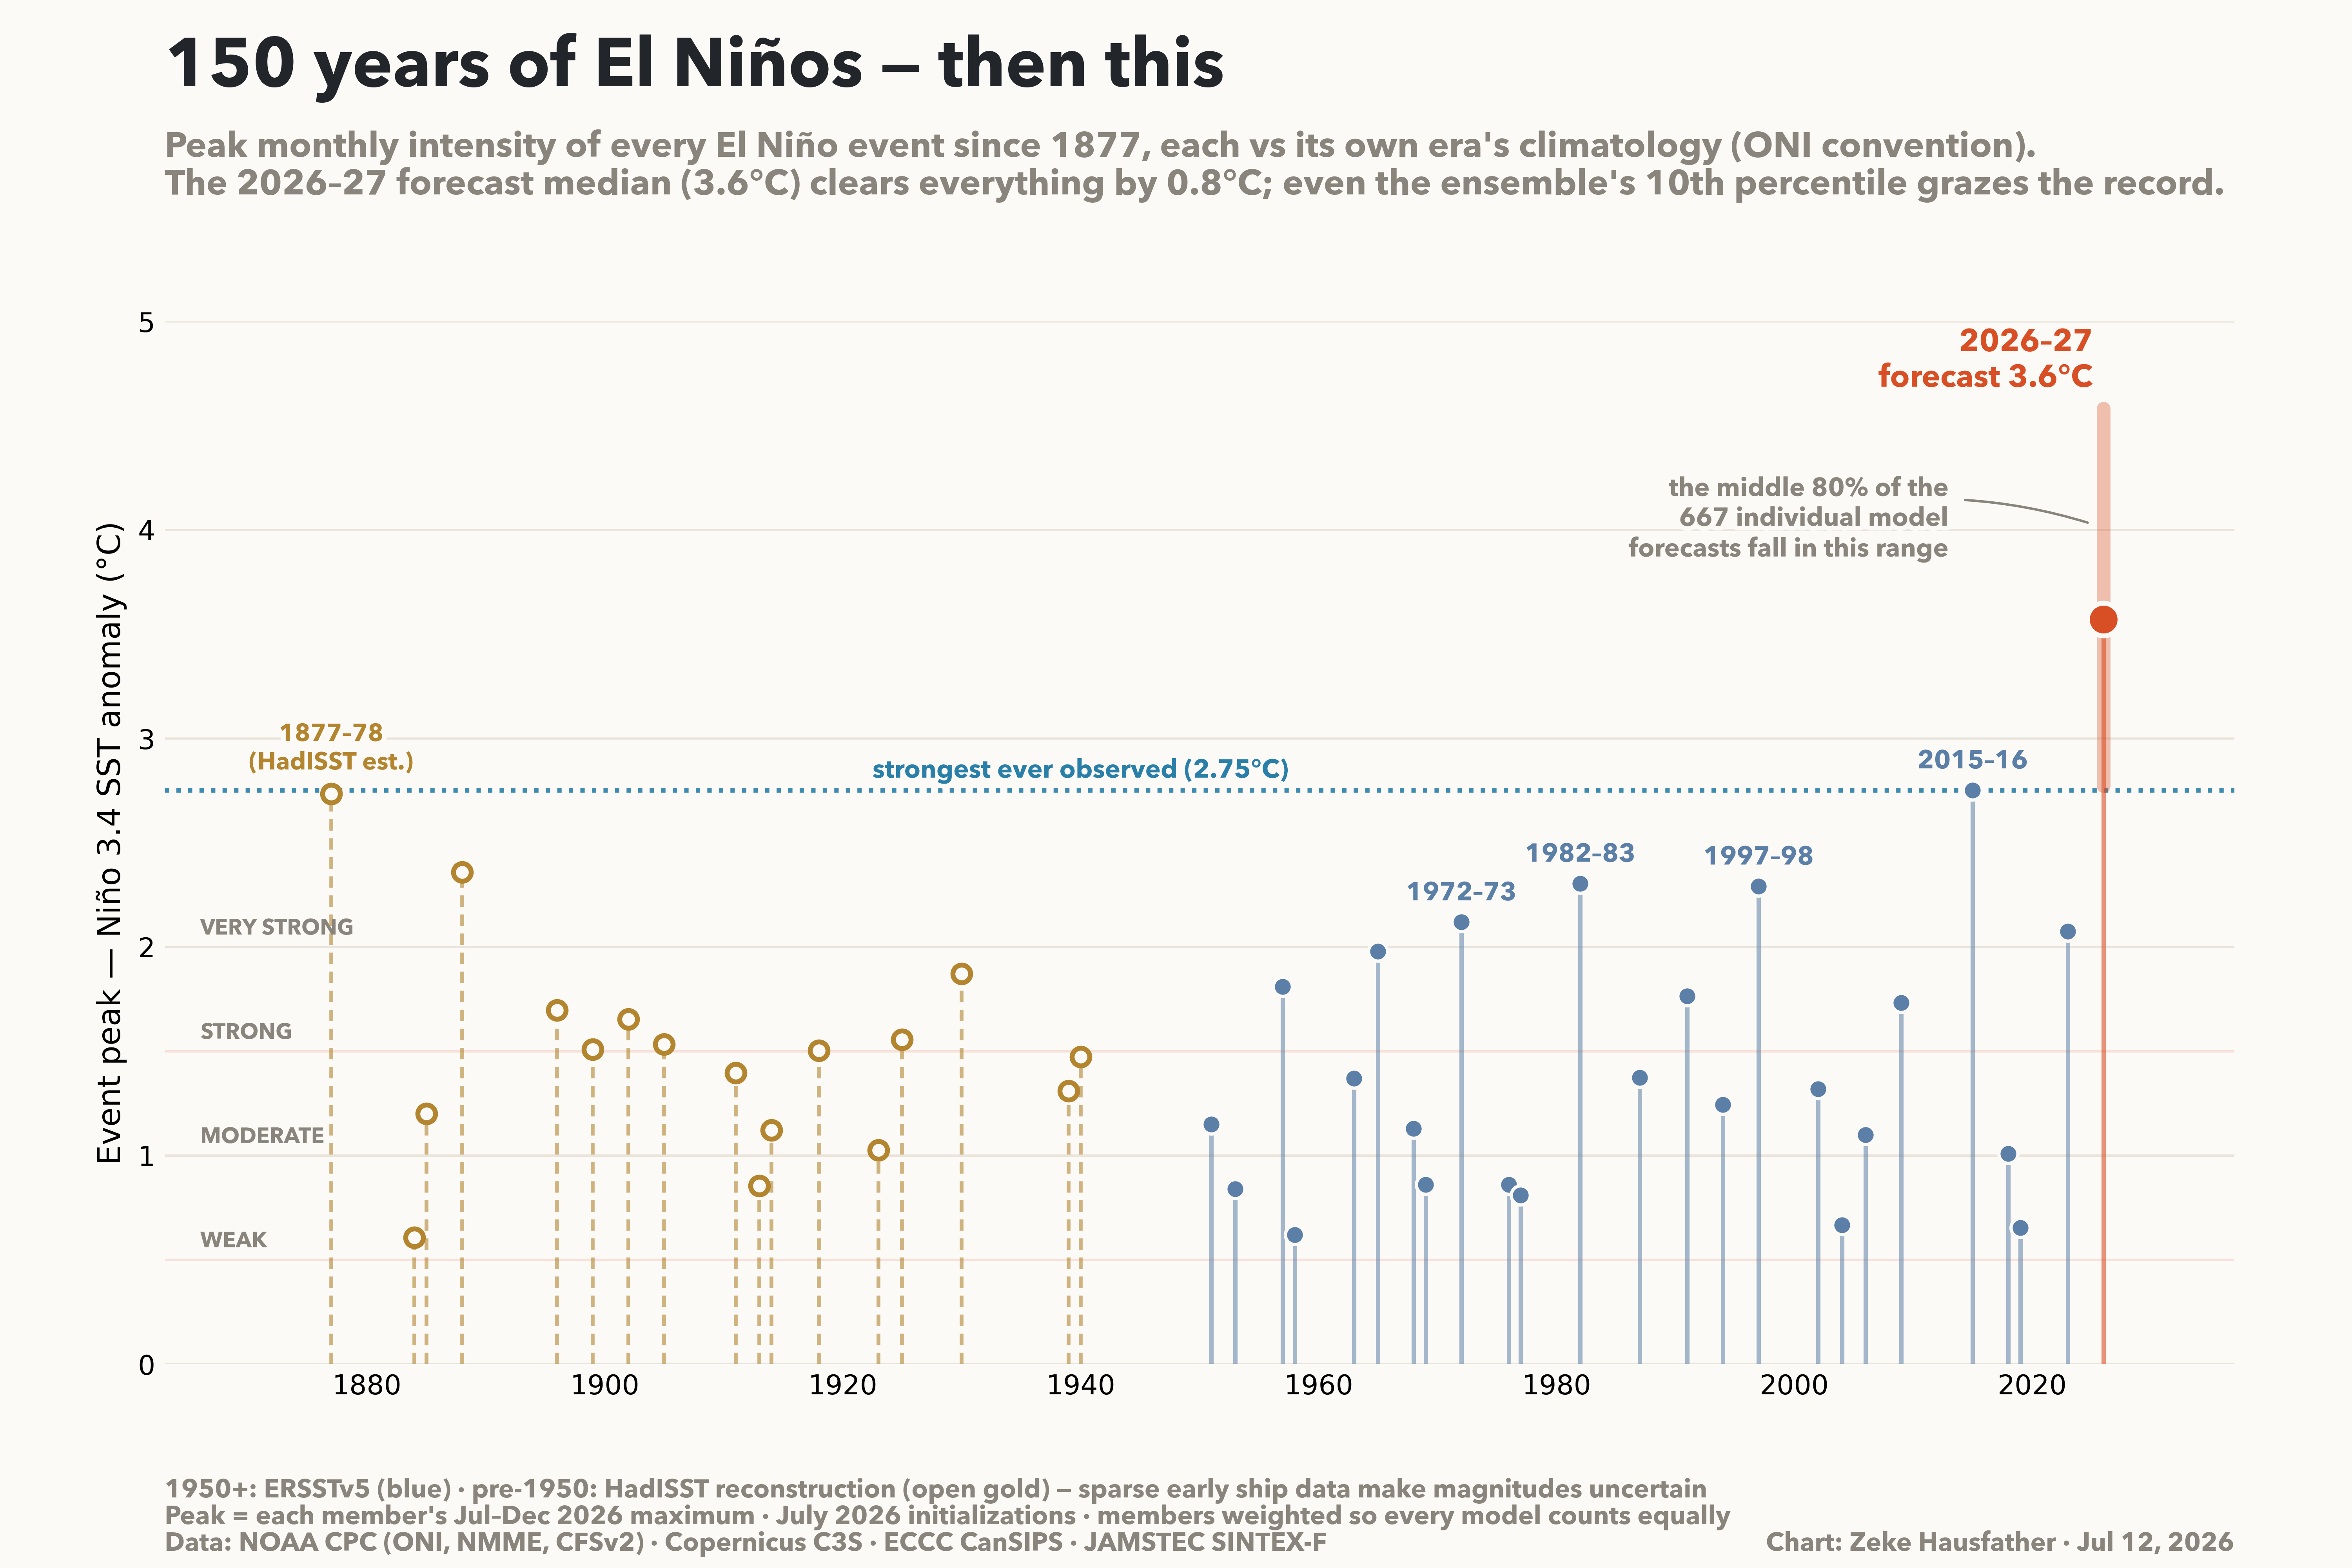
A few things stand out in this figure. First, no event in a century and a half of observations has ever pushed meaningfully past 2.75C. The legendary 1877-78 event comes closest, in a statistical dead heat with 2015-16 (2.73C vs 2.75C, well within the uncertainty of 19th-century ship data). Second, the middle 80% of this year’s forecast ensemble sits entirely at or above that all-time record: even the low end of the plume (2.8C) grazes it. Around 91% of ensemble members exceed the 2015-16 record at their peak.
To see what this would look like as the event unfolds, we can compare the forecast trajectory against the five strongest events ever observed, month by month through the development year and into the following spring.
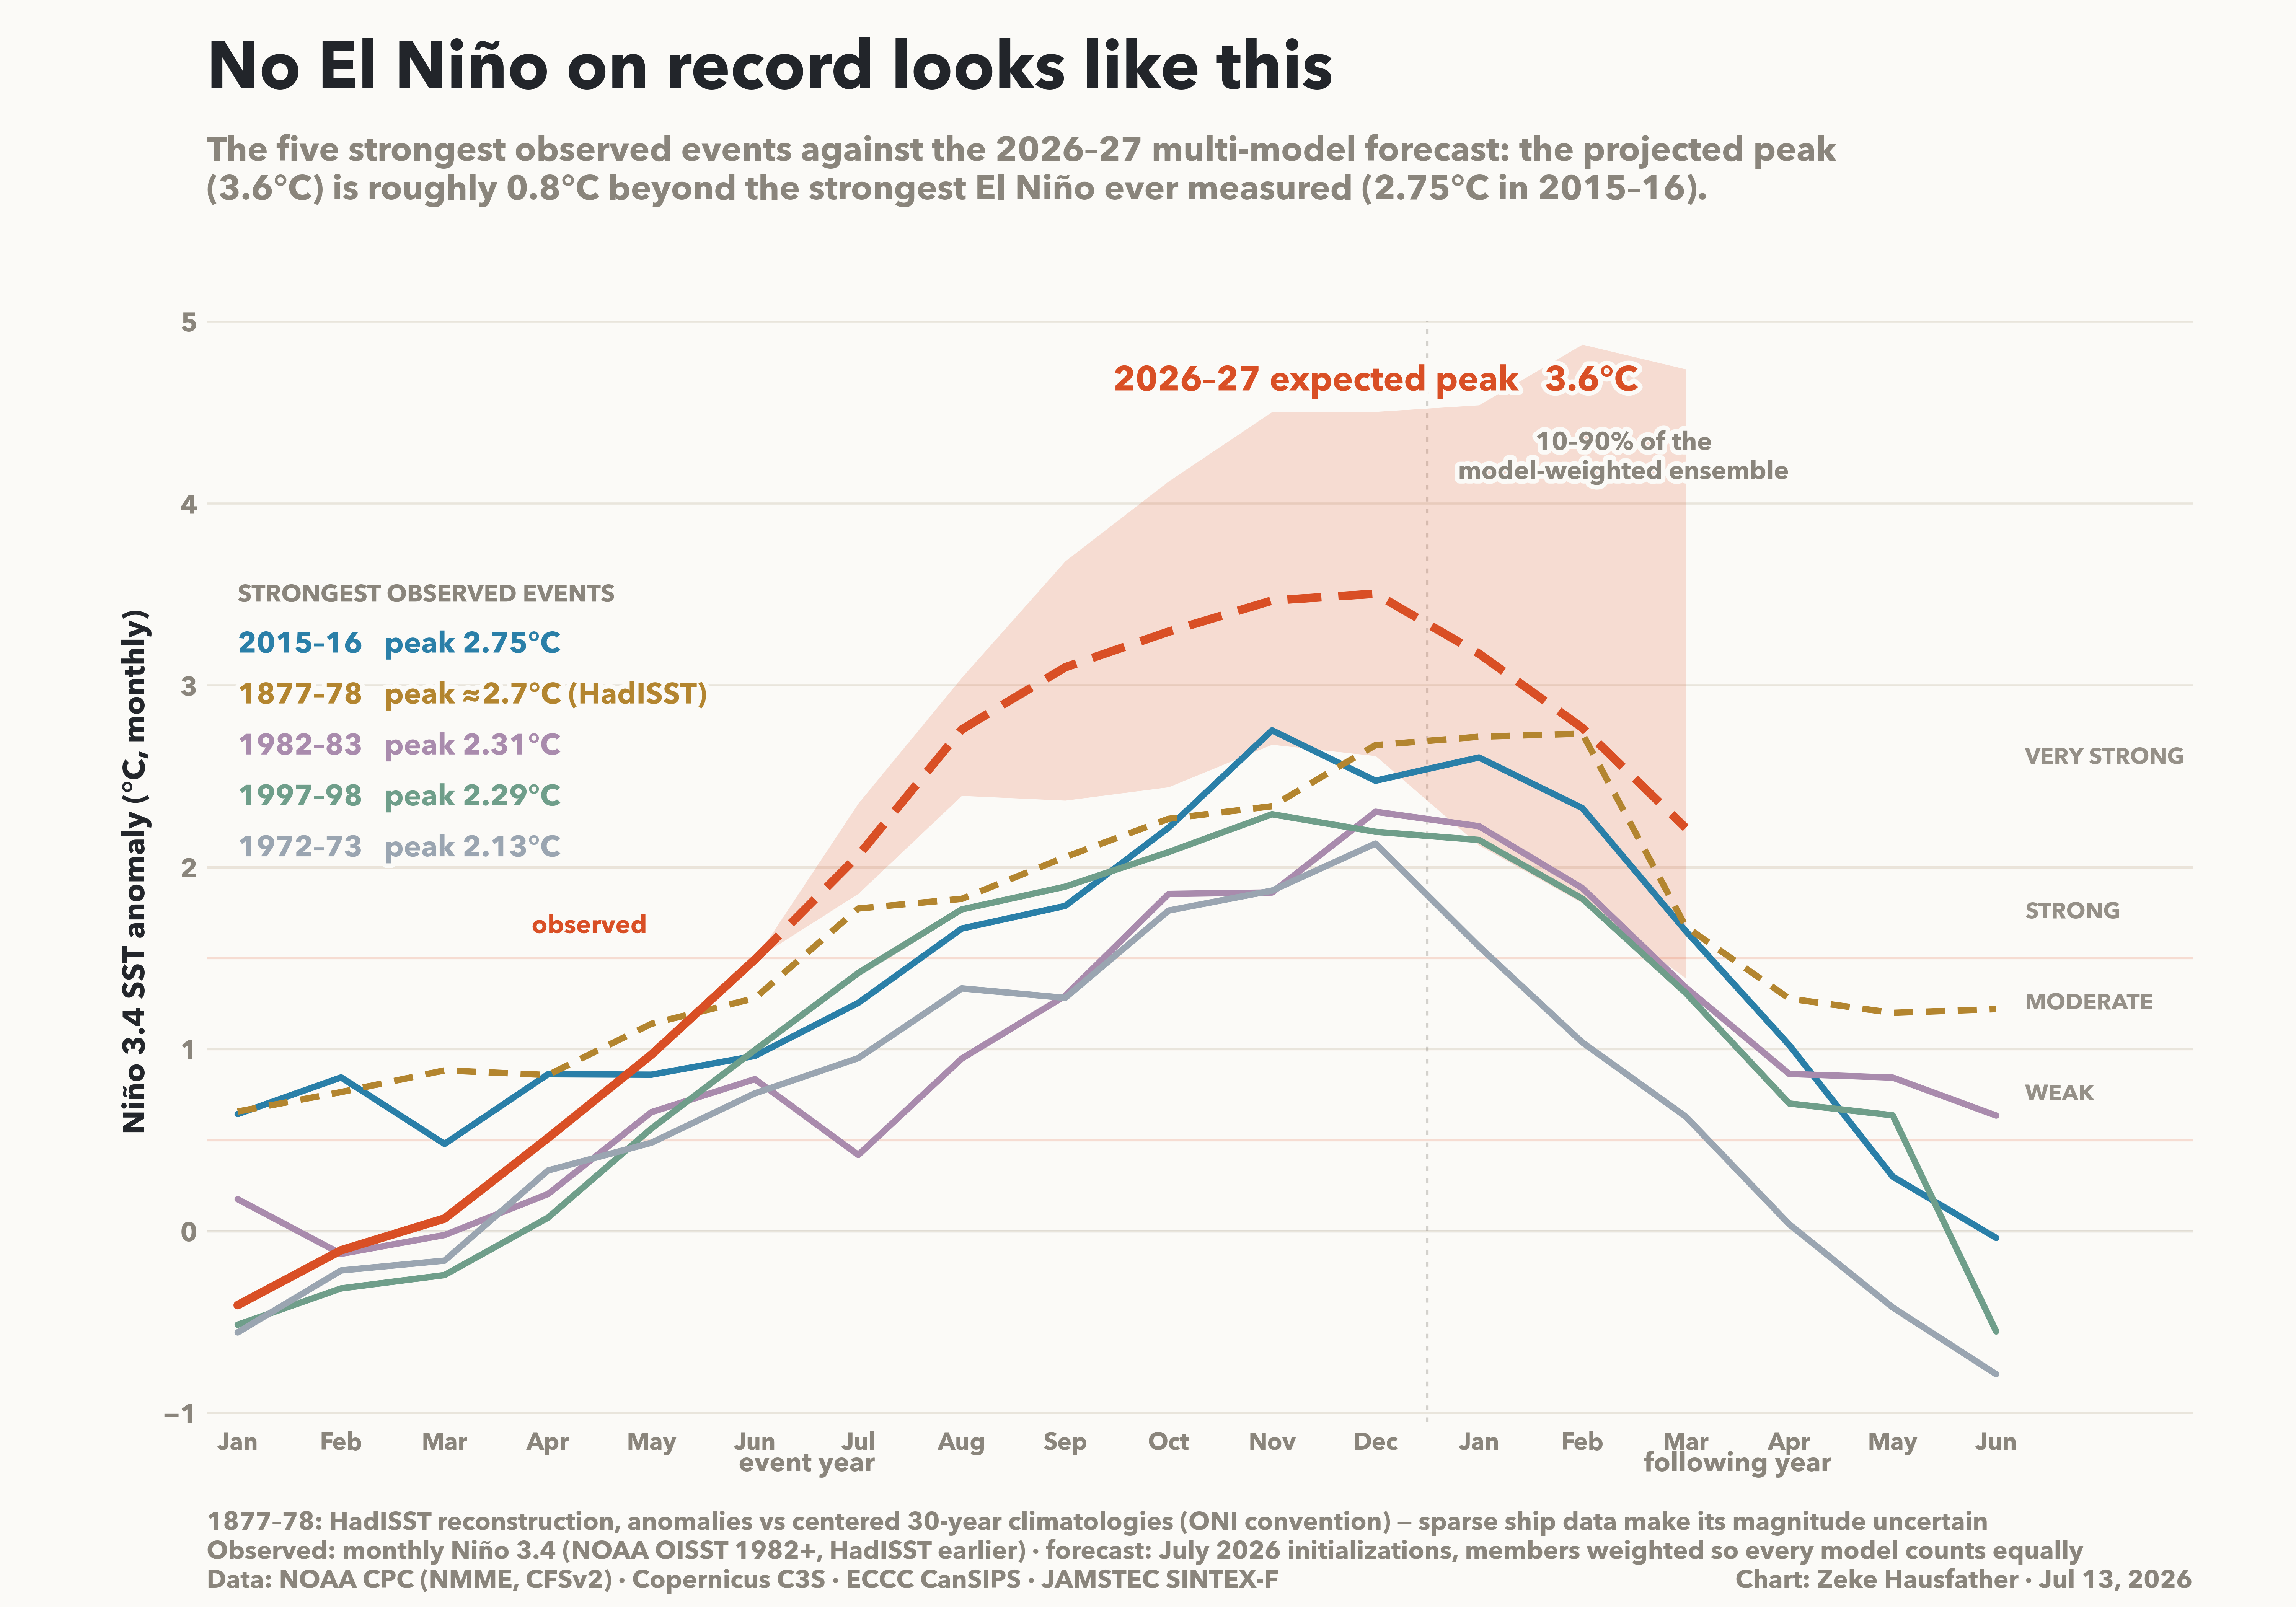
What is remarkable here is not just the level but the trajectory. The 2026 event is developing faster than 1997-98, the previous gold standard for explosive El Niño onsets. And unlike 2015 which started its year already warm from a precursor event, this one launched from genuinely La Niña-ish conditions in January.
Of course, a multi-model median can hide a lot of disagreement, so it is worth looking at where each individual model puts the peak. The figure below shows the distribution of member peaks across all 14 models.
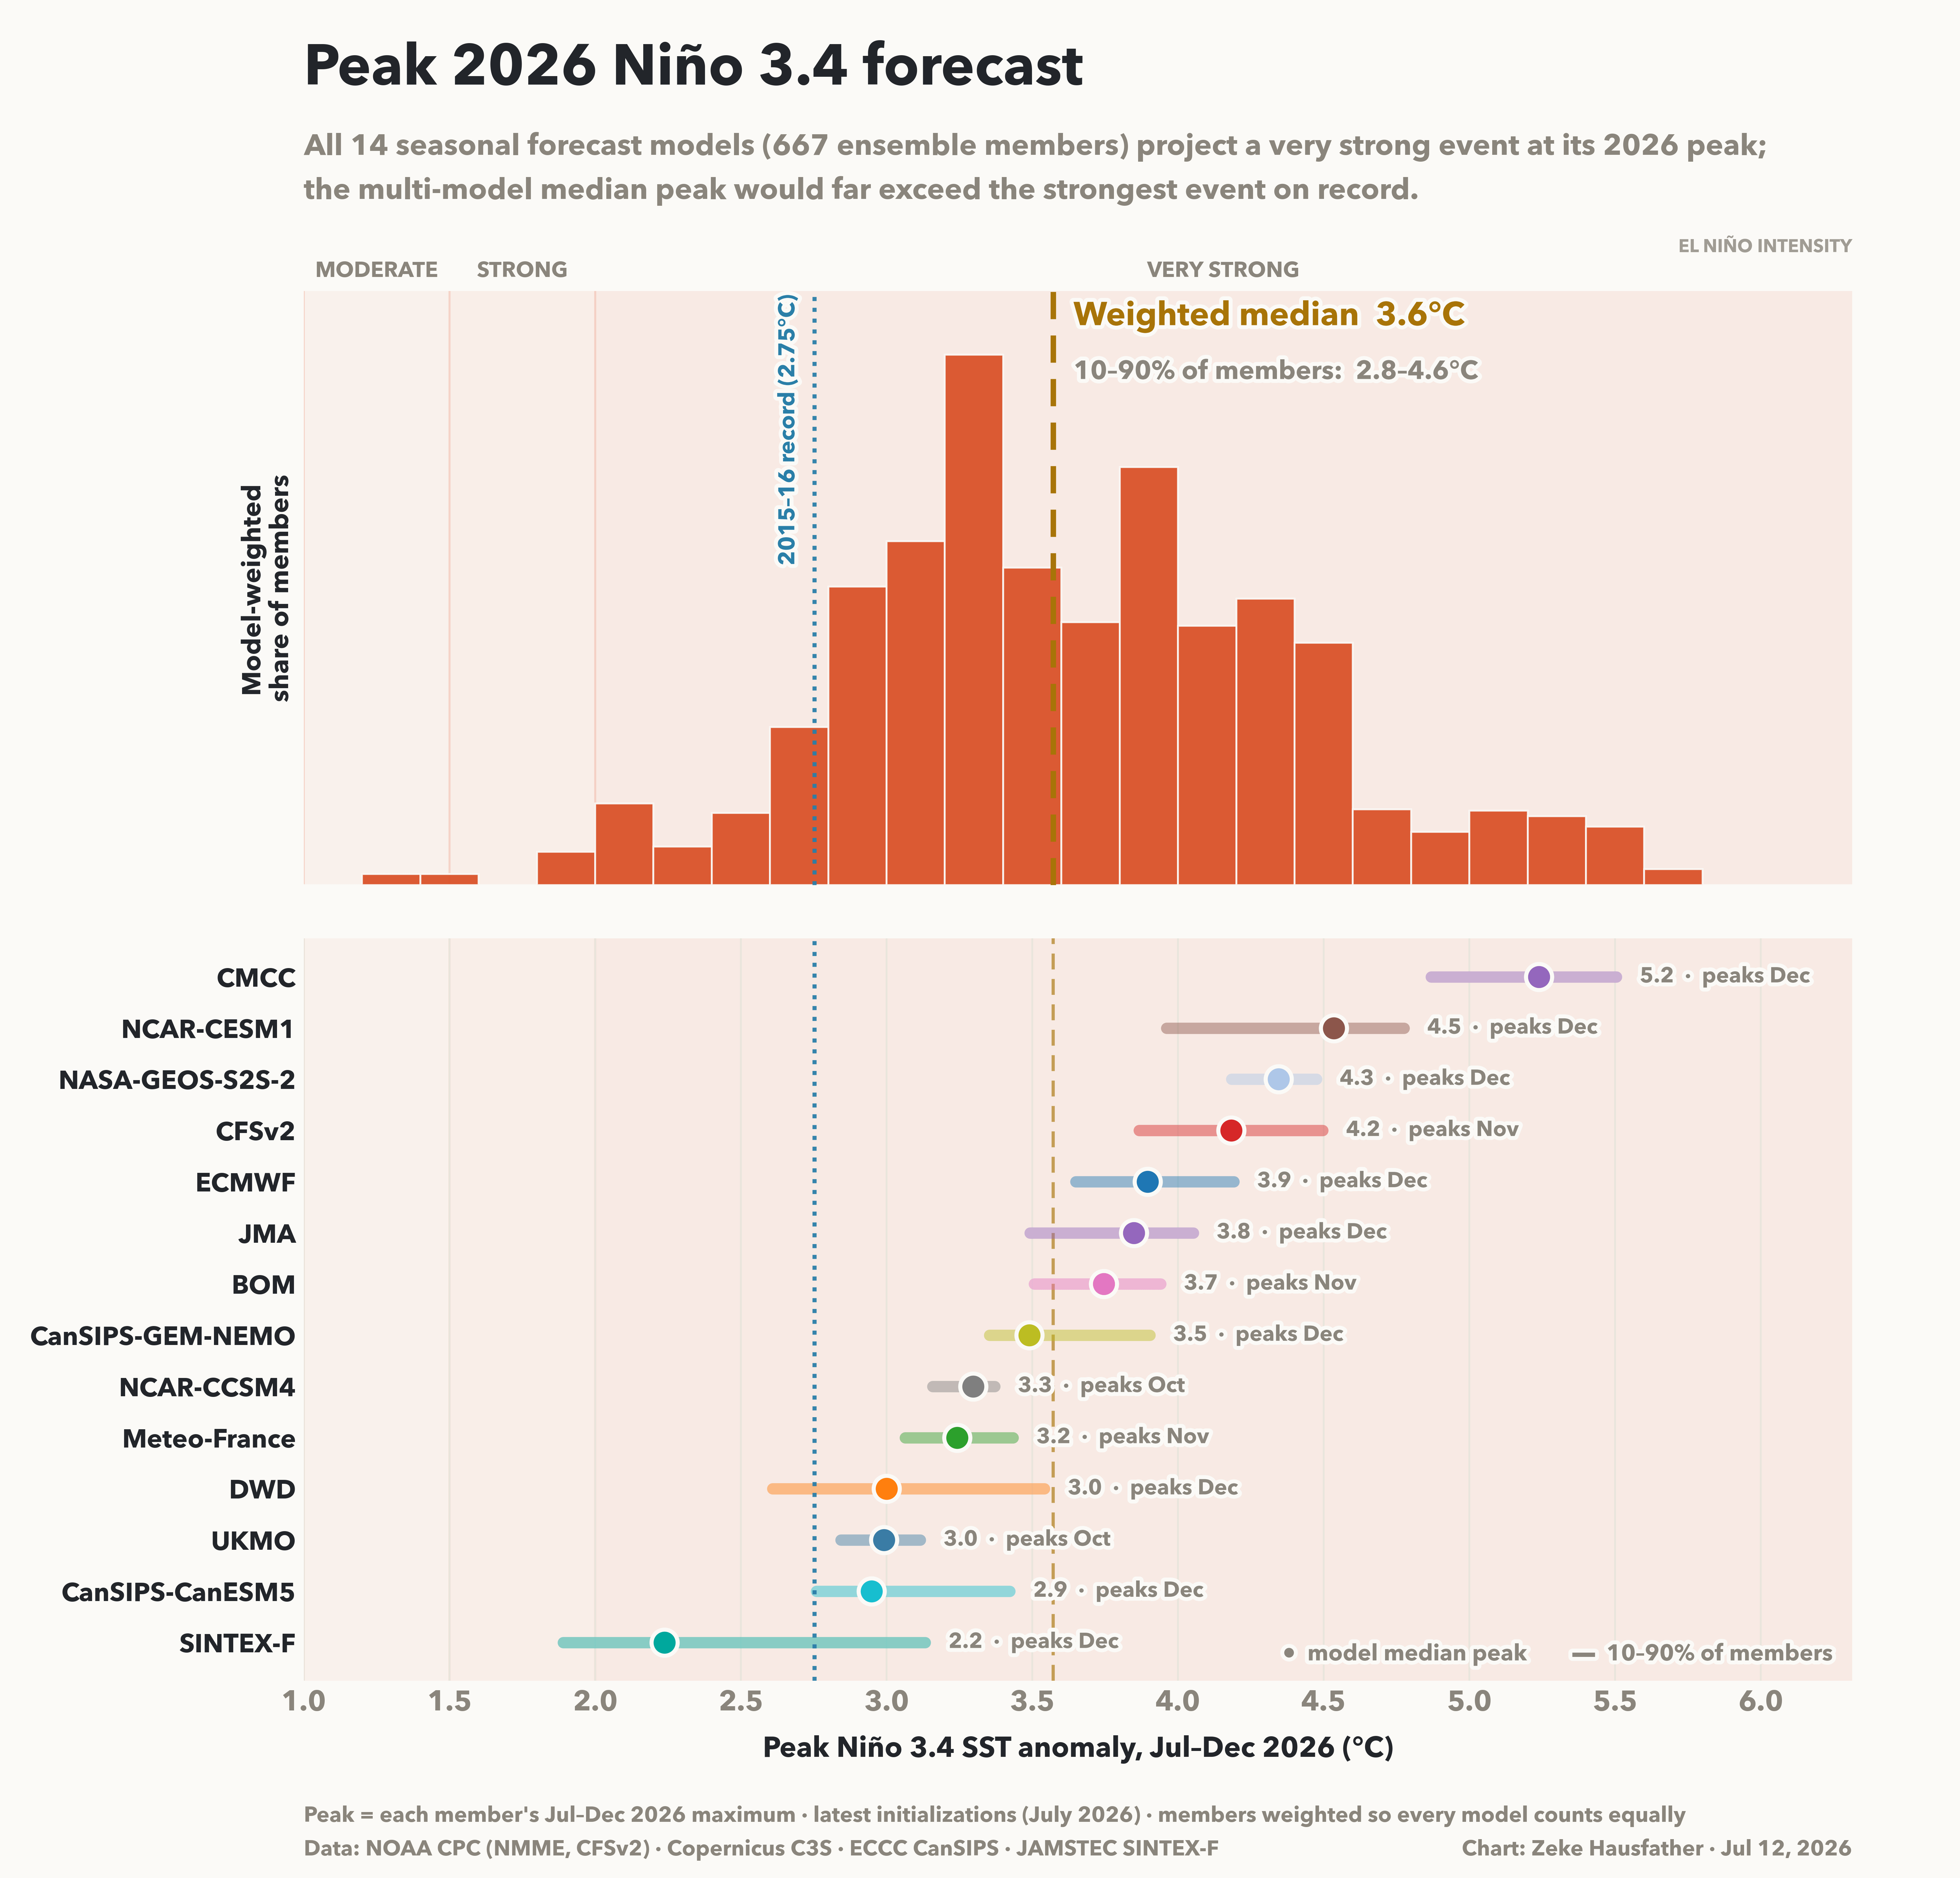
Every single model’s median peak lands at very strong (”super”) El Niño intensity, and all but one (JAMSTEC’s SINTEX-F, at 2.2C) put their median above the 2015-16 record. Model agreement this strong is unusual, though I’d note that agreement is not the same thing as skill as I discuss later on.
Long-time readers may recall that in a warming world, the raw Niño 3.4 anomaly risks conflating El Niño with the broader ocean warming trend. NOAA’s answer is the relative ONI (RONI), which subtracts the tropical-mean SST anomaly to isolate the ENSO signal. In RONI terms the record holder is actually 1982-83 (a peak monthly value of 2.69C), not 2015-16. However, even using RONI the multi-model median in 11 of the 14 models shows a record event.
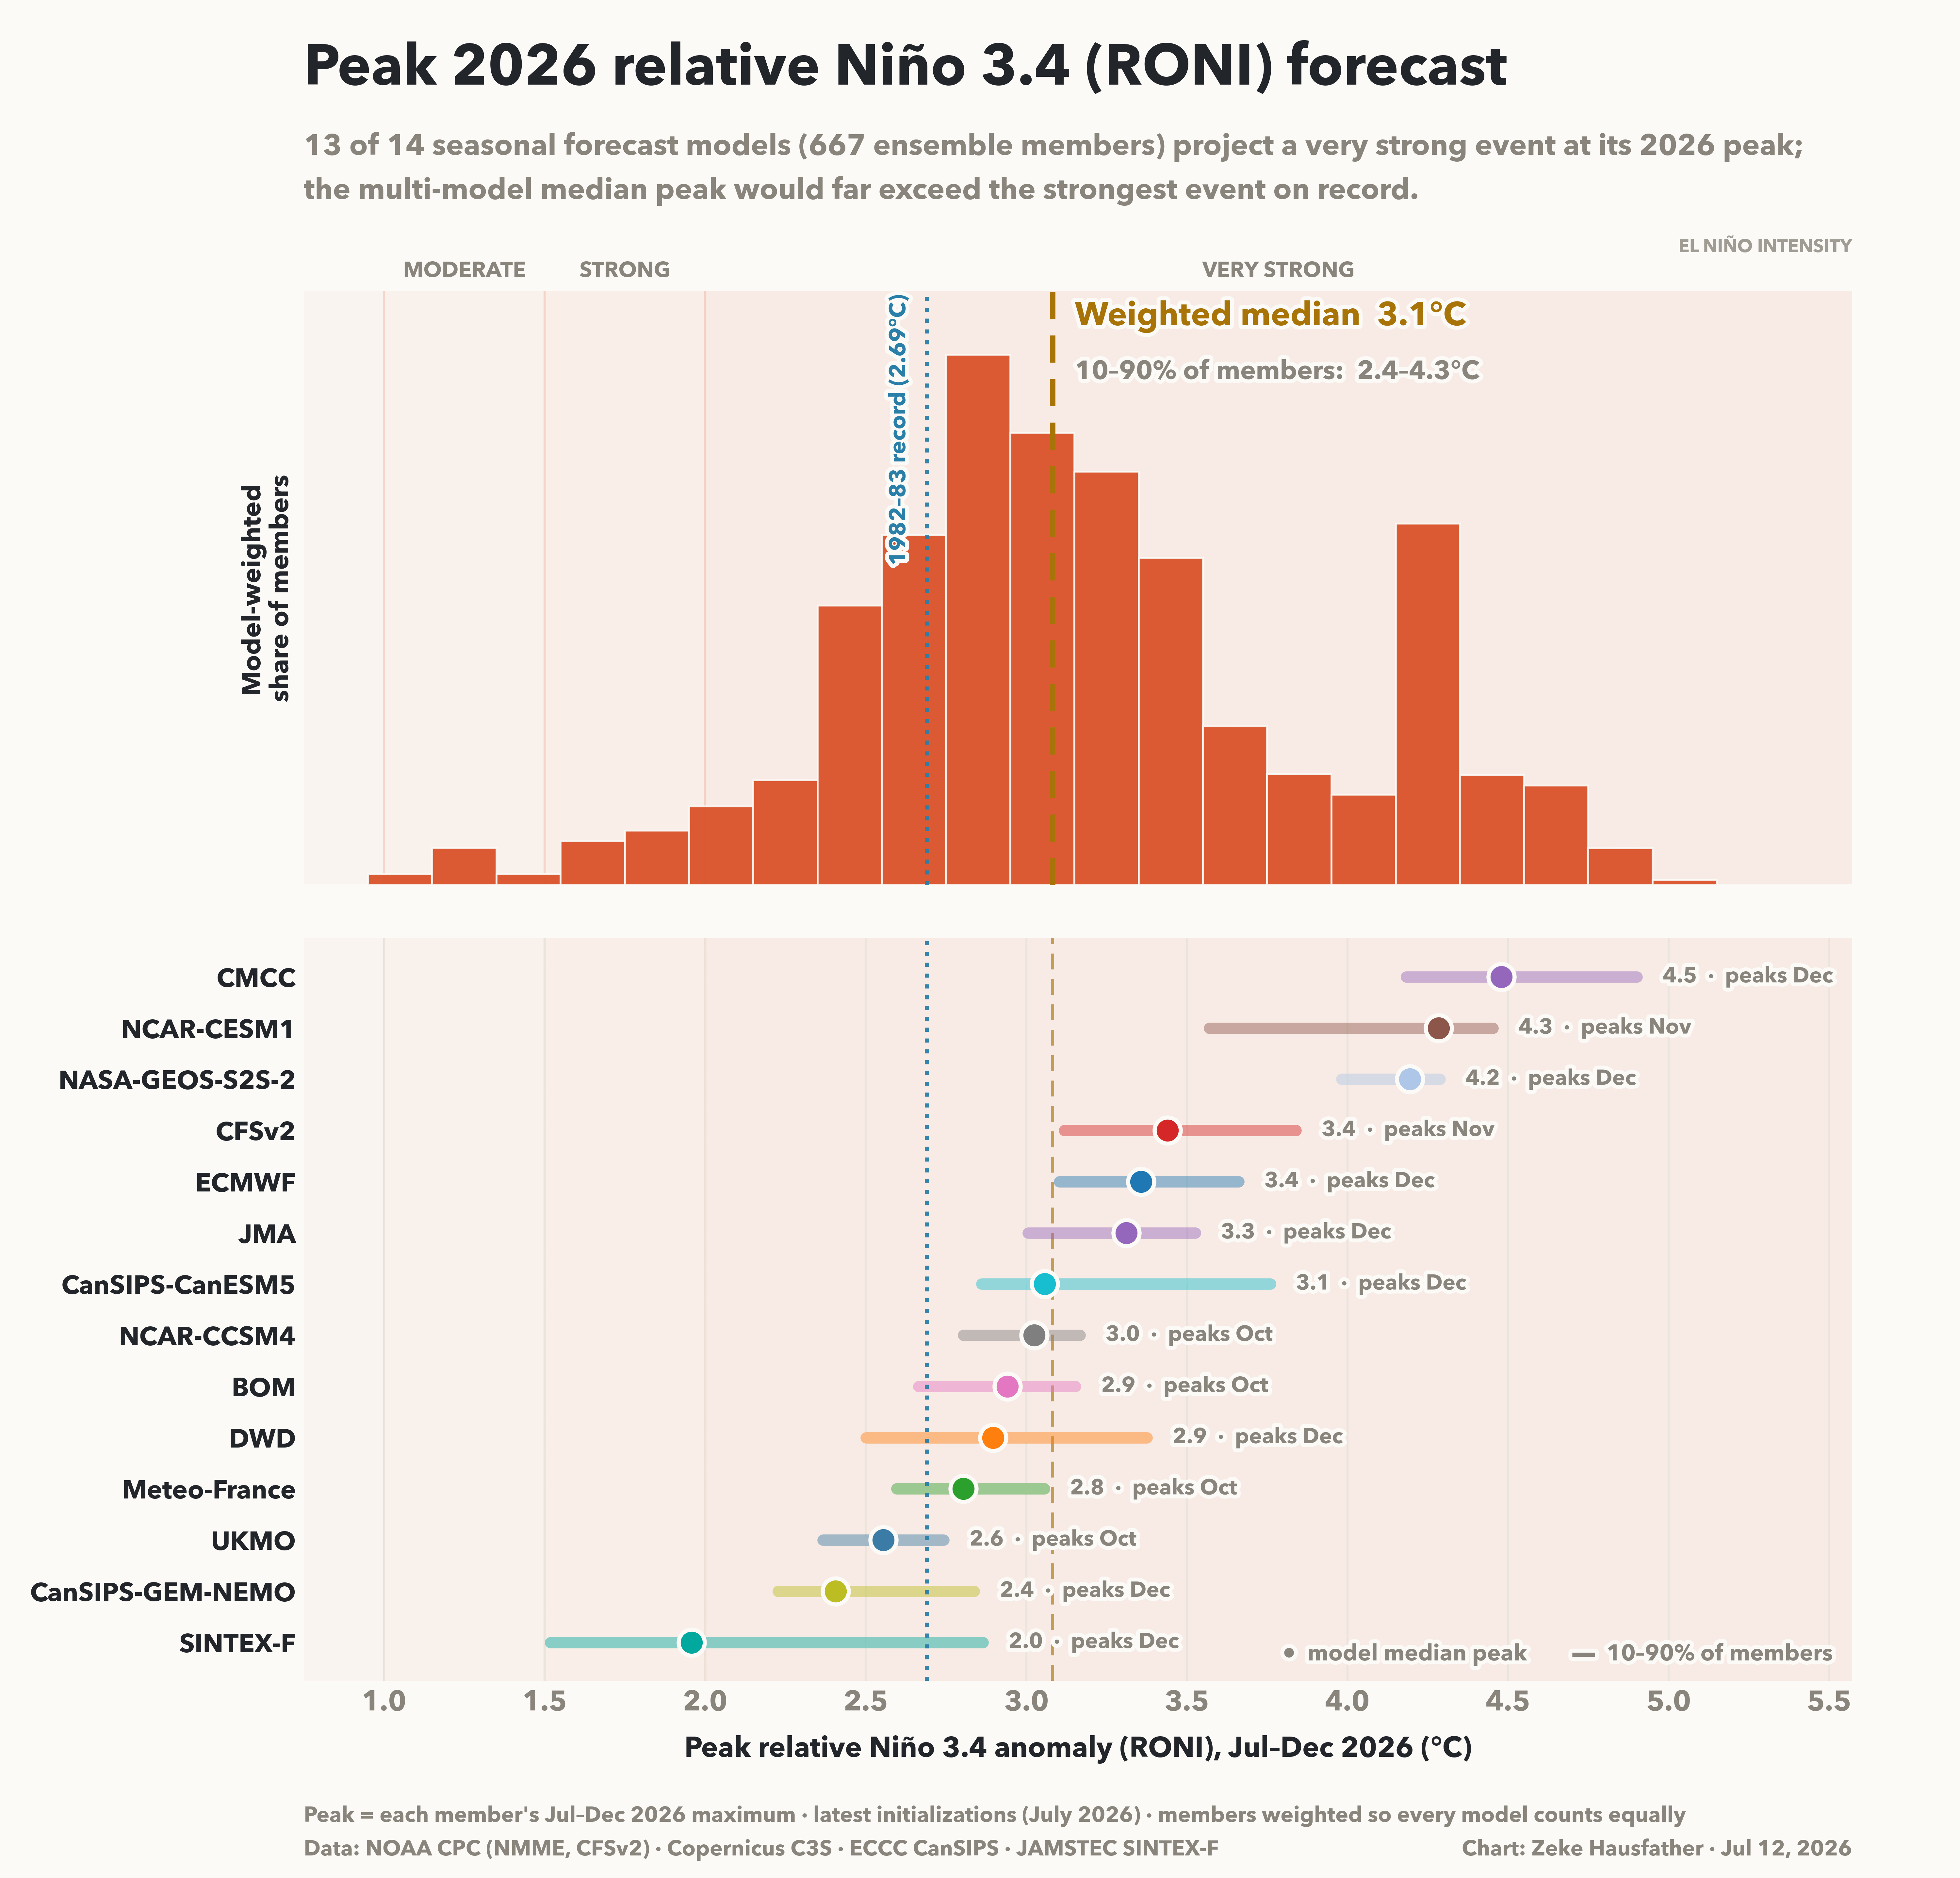
Putting the two together: models give a ~91% chance of a record peak in Niño 3.4 terms and ~77% in RONI terms this year. Whichever way you slice the index, the forecast says the same thing: this is more likely than not to be the strongest El Niño ever observed.
So how did we get here? The forecast has been building all spring. The figure below shows how each model’s projection evolved from its March run through its July run, against observed monthly conditions.
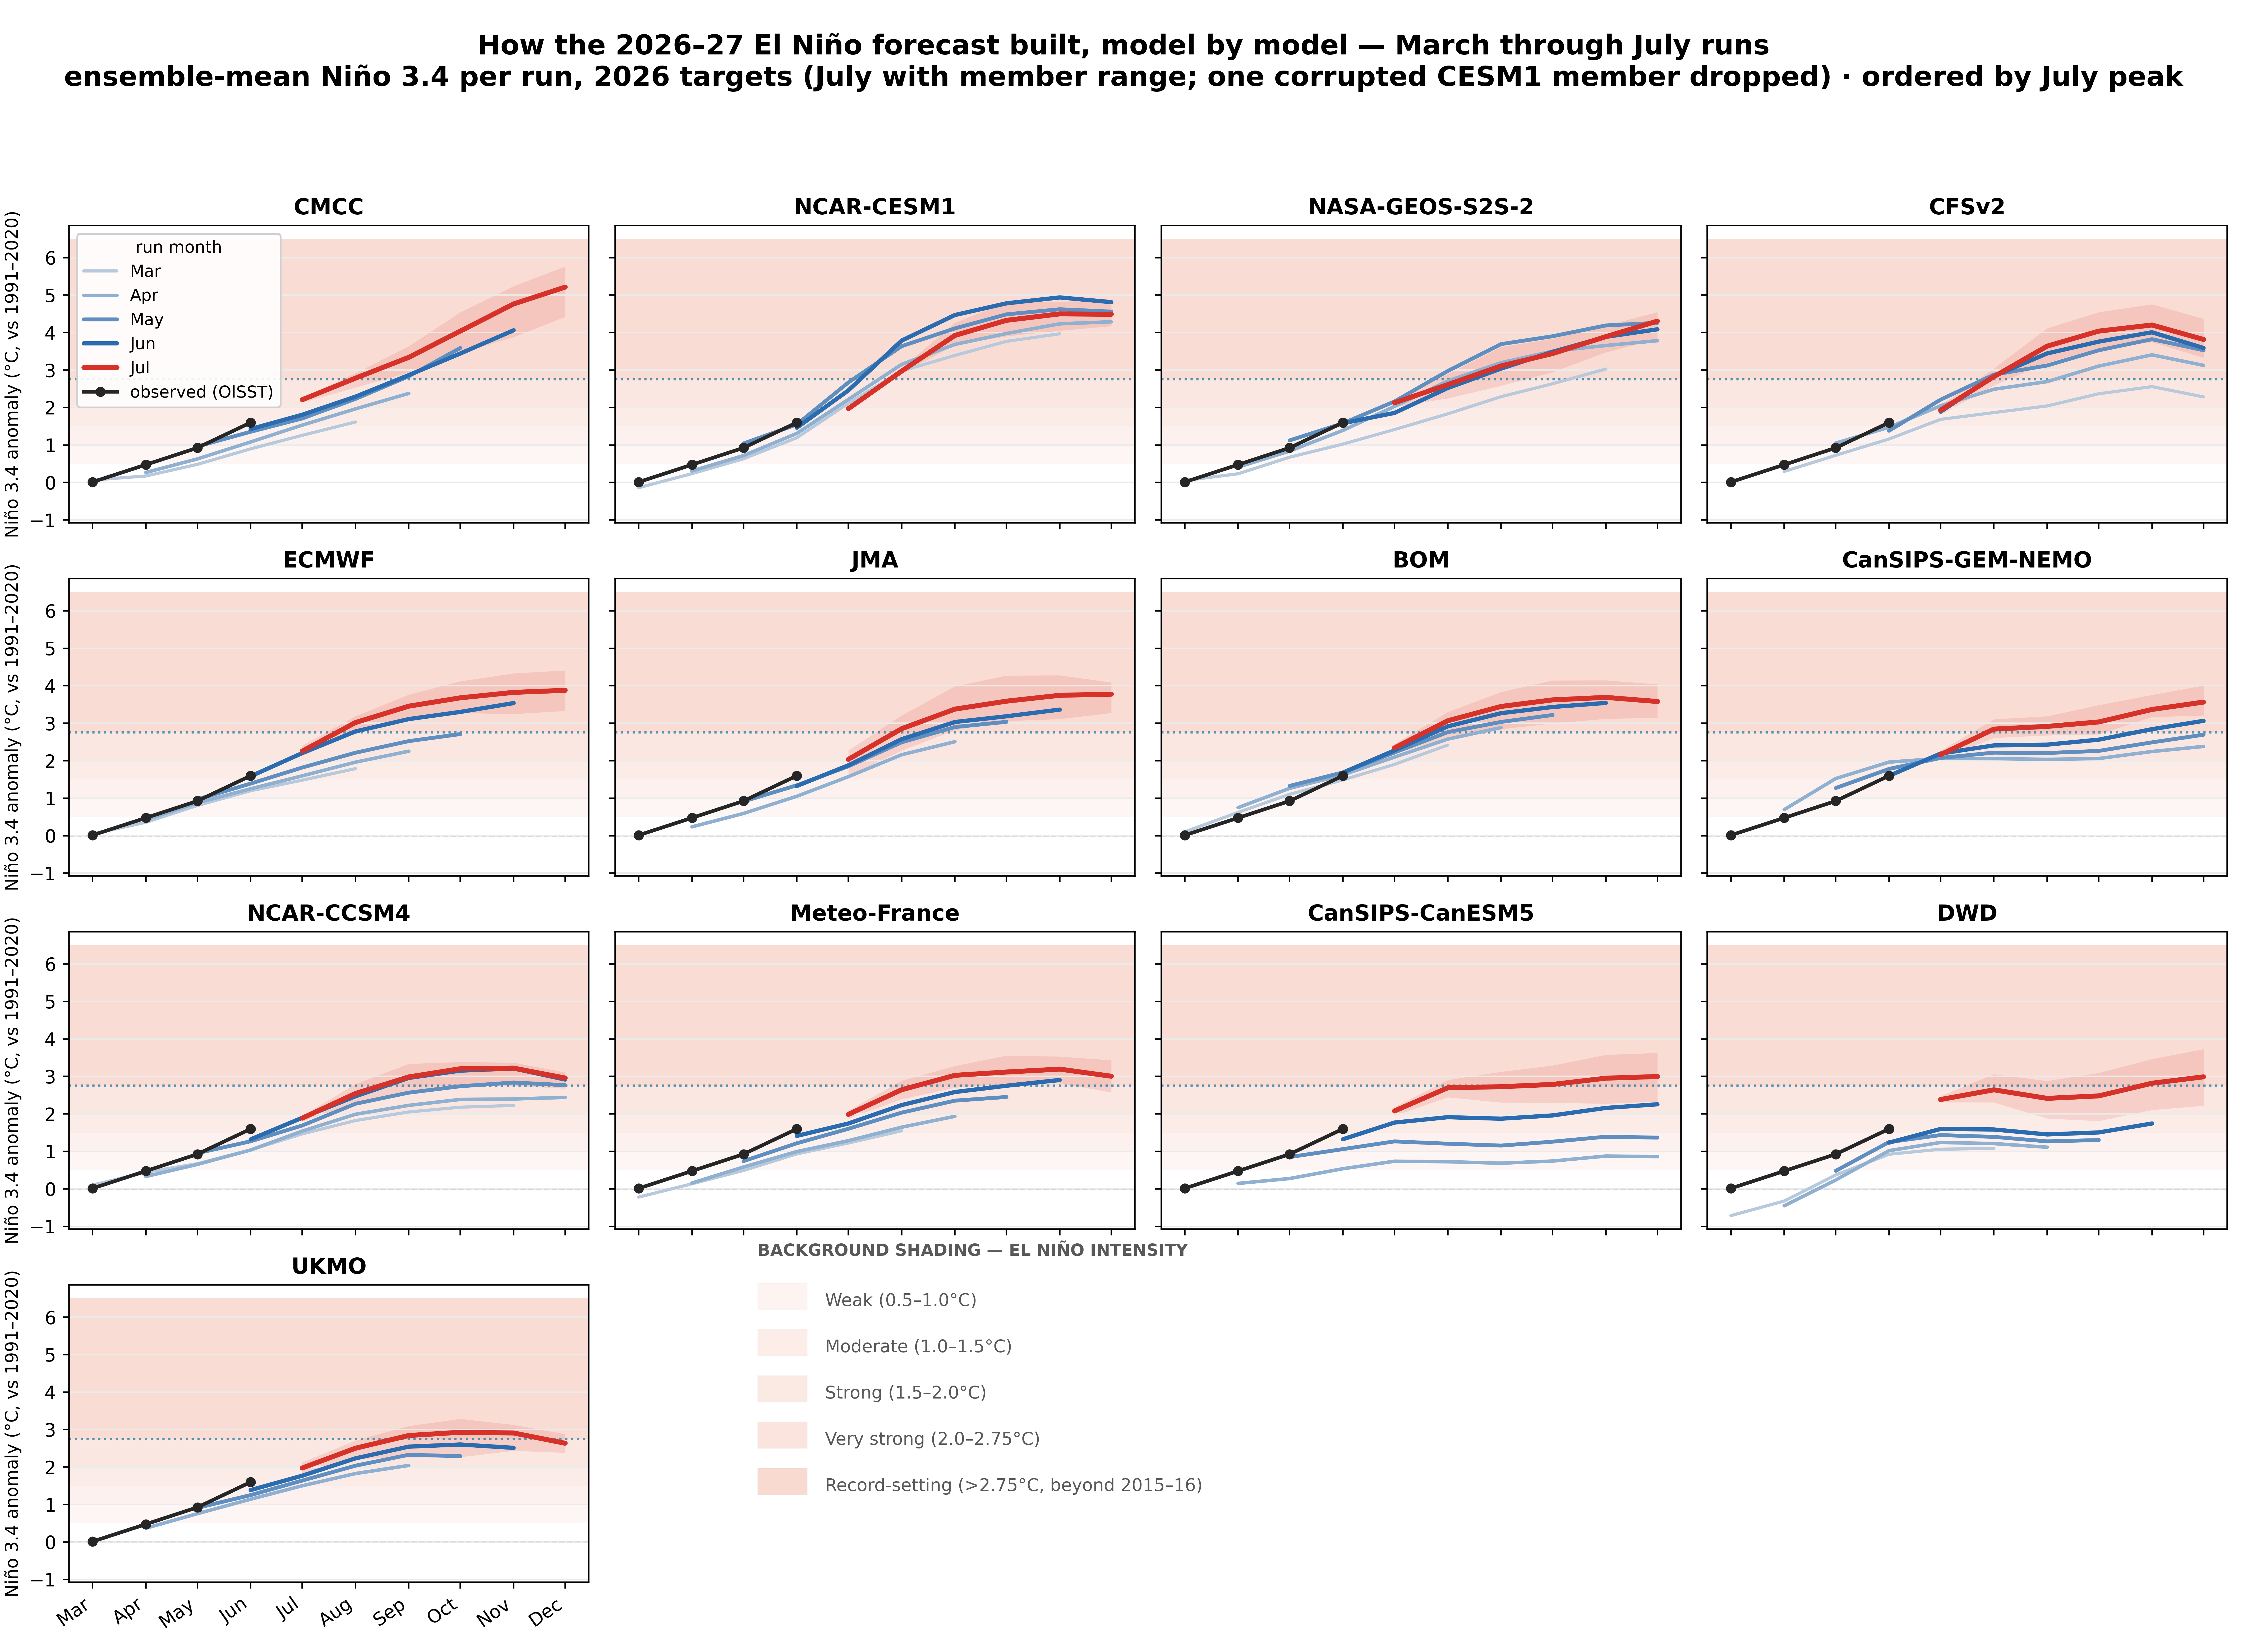
Nearly every panel shows the same thing: each successive run warmer than the last, across five months and thirteen independent modeling systems.2 This pattern of sustained revision as initialization improves is the classic signature of a real intensifying event rather than model noise. The reason is visible in the black line: observed conditions kept outrunning the forecasts. (Though credit where credit is due: NCAR’s CESM1 was calling ~4C back in March when that looked absurd, and I and others called it out as unrealistic at the time. The ensemble has since converged toward it.)
The combined multi-model picture makes the same point more concisely.
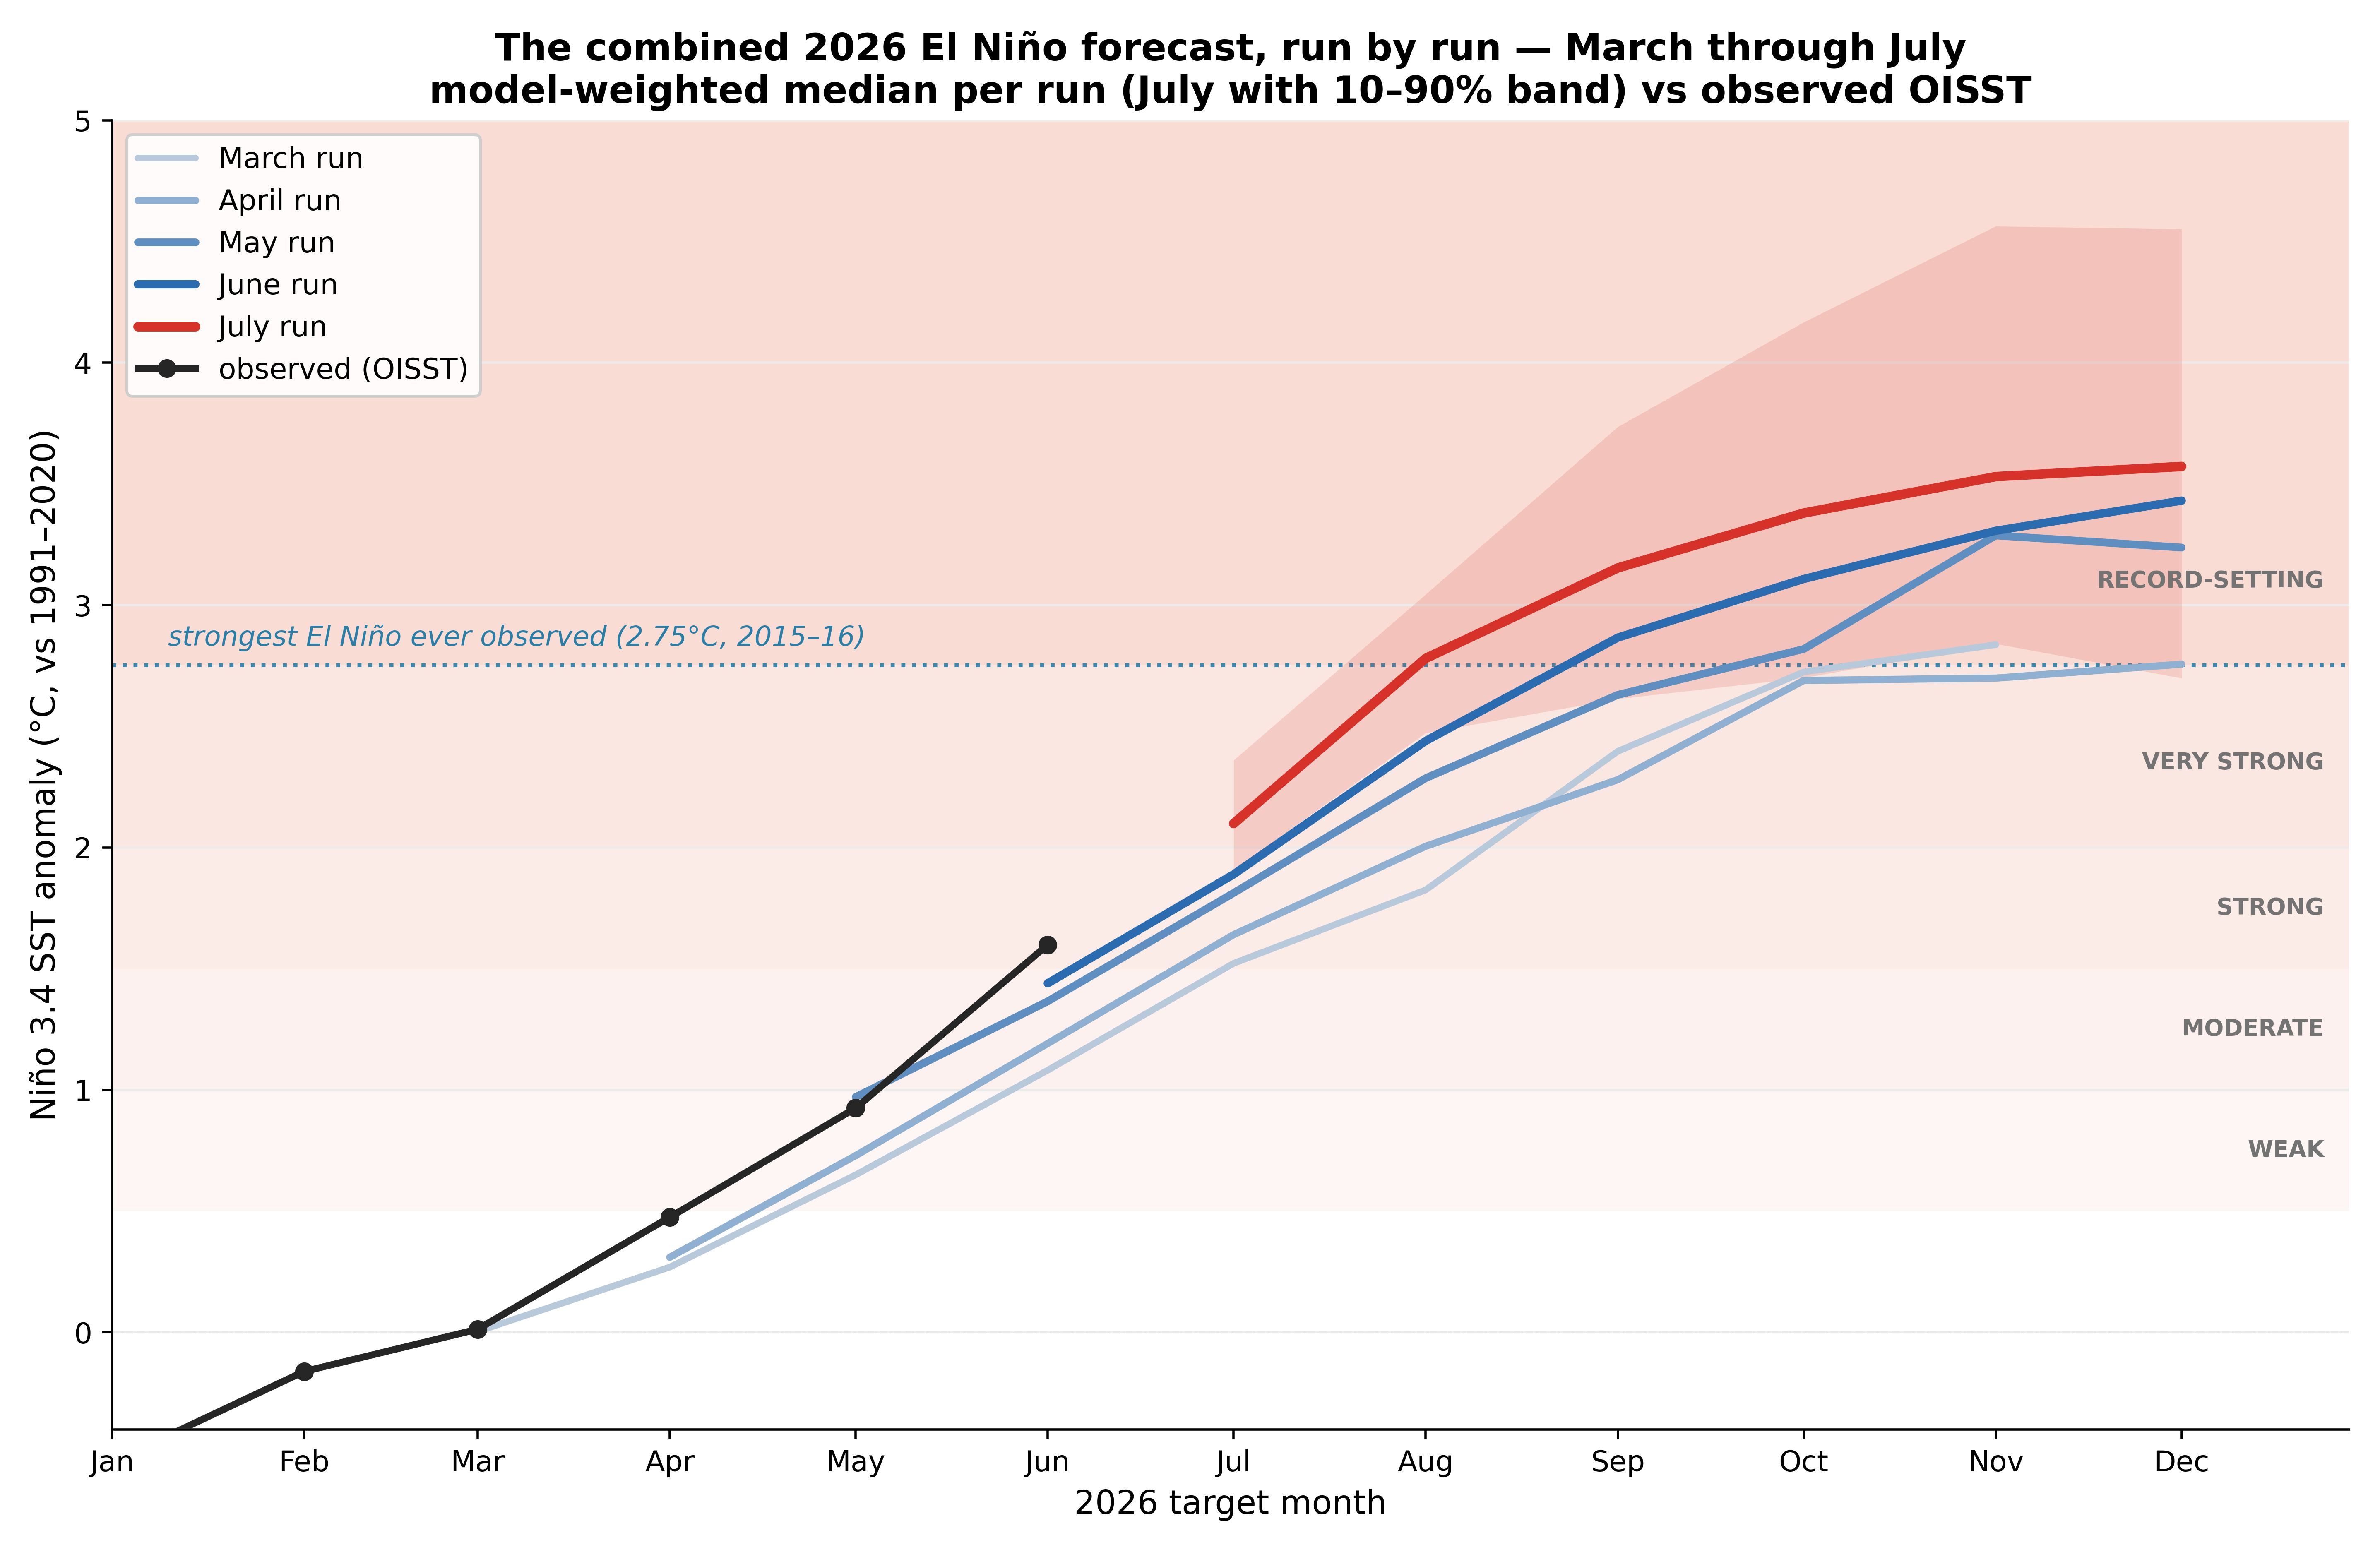
The peak median has climbed from ~2.8C in the March runs to 3.6C in July — though notably the revisions are decelerating (+0.5C, +0.14C, +0.14C over the last three cycles), suggesting the forecast is converging rather than still escalating.
It is also worth looking at what this event looks like spatially. The figure below maps each model’s SST anomaly field at its own forecast peak month.
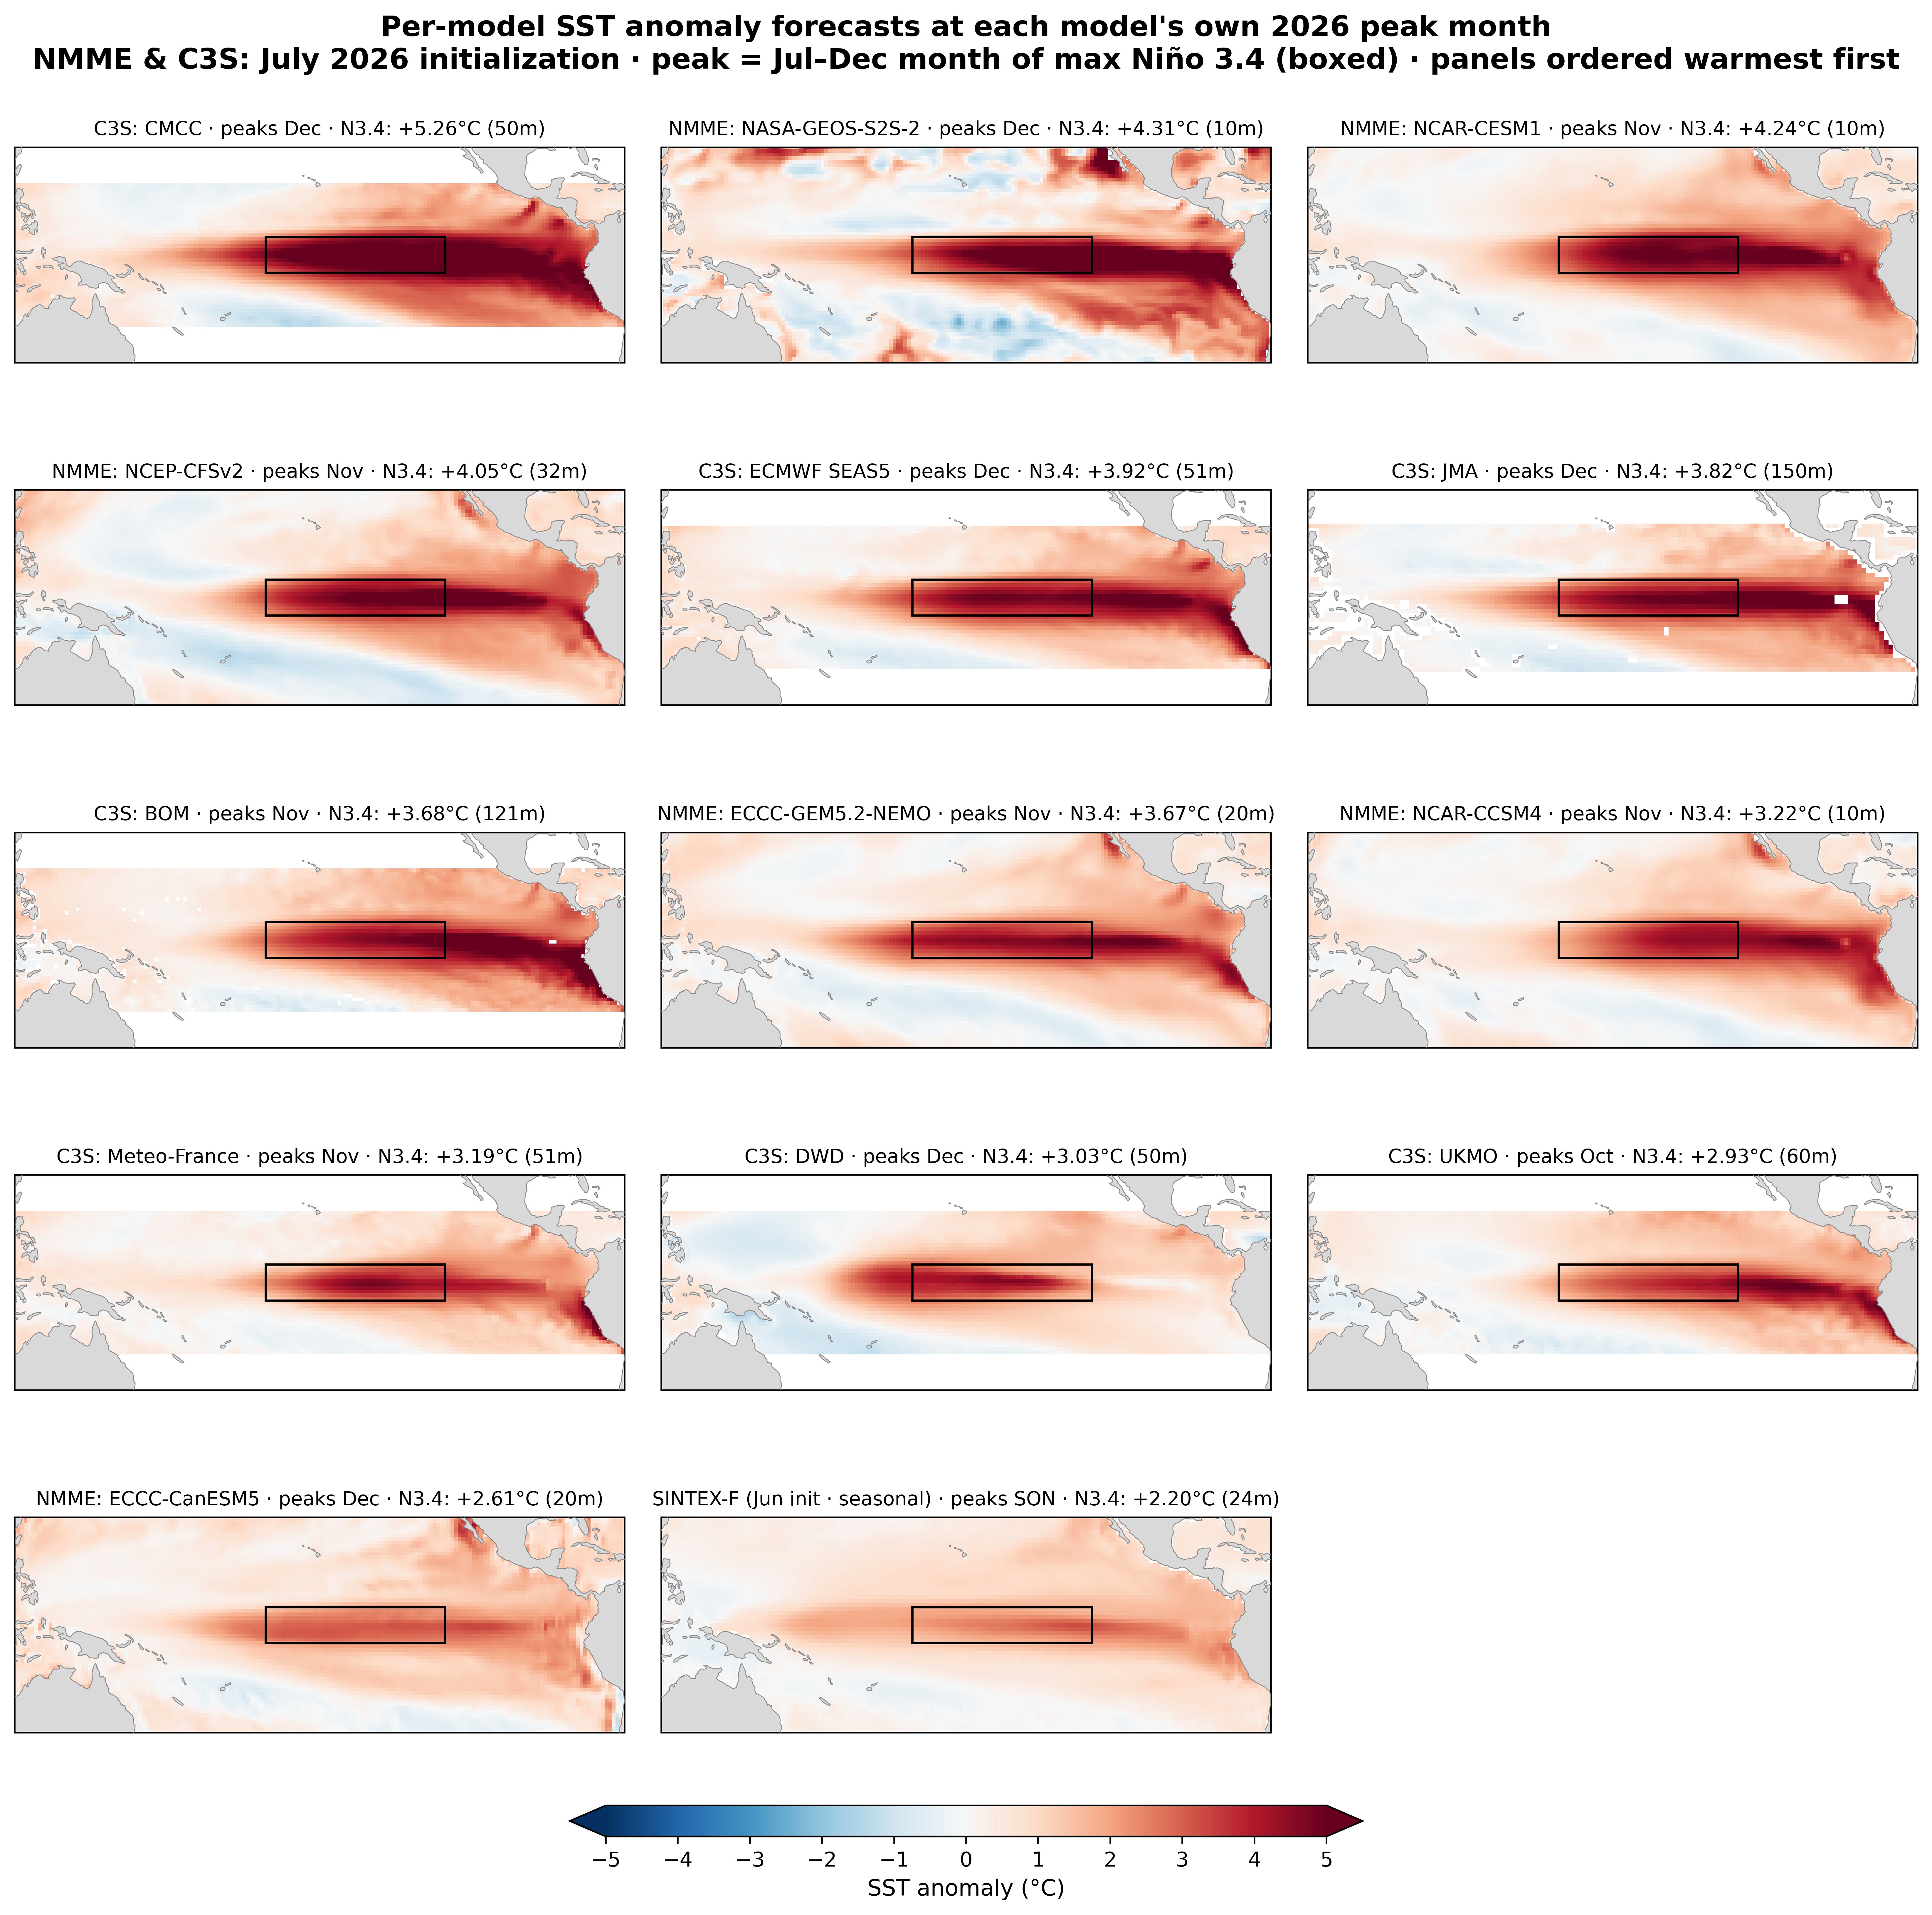
The classic east-Pacific El Niño tongue is there in every model. I’d flag CMCC as the outlier to discount: its 5.3C peak sits a full 1.3C above the next warmest model. Because we are looking at the multi-model median, even discounting CMCC doesn’t change the overall forecast meaningfully.
Meanwhile, the ocean is not waiting for the models. Daily SSTs in the Niño 3.4 region are already running around 2C above their era-adjusted average – the threshold for a very strong (”super”) El Niño if sustained – and it is only mid-July. The figure below puts this in context, showing the daily Niño 3.4 anomaly for every year in the satellite record, with each year measured against its own era’s climatology so the long-term warming trend doesn’t mess up the comparison.
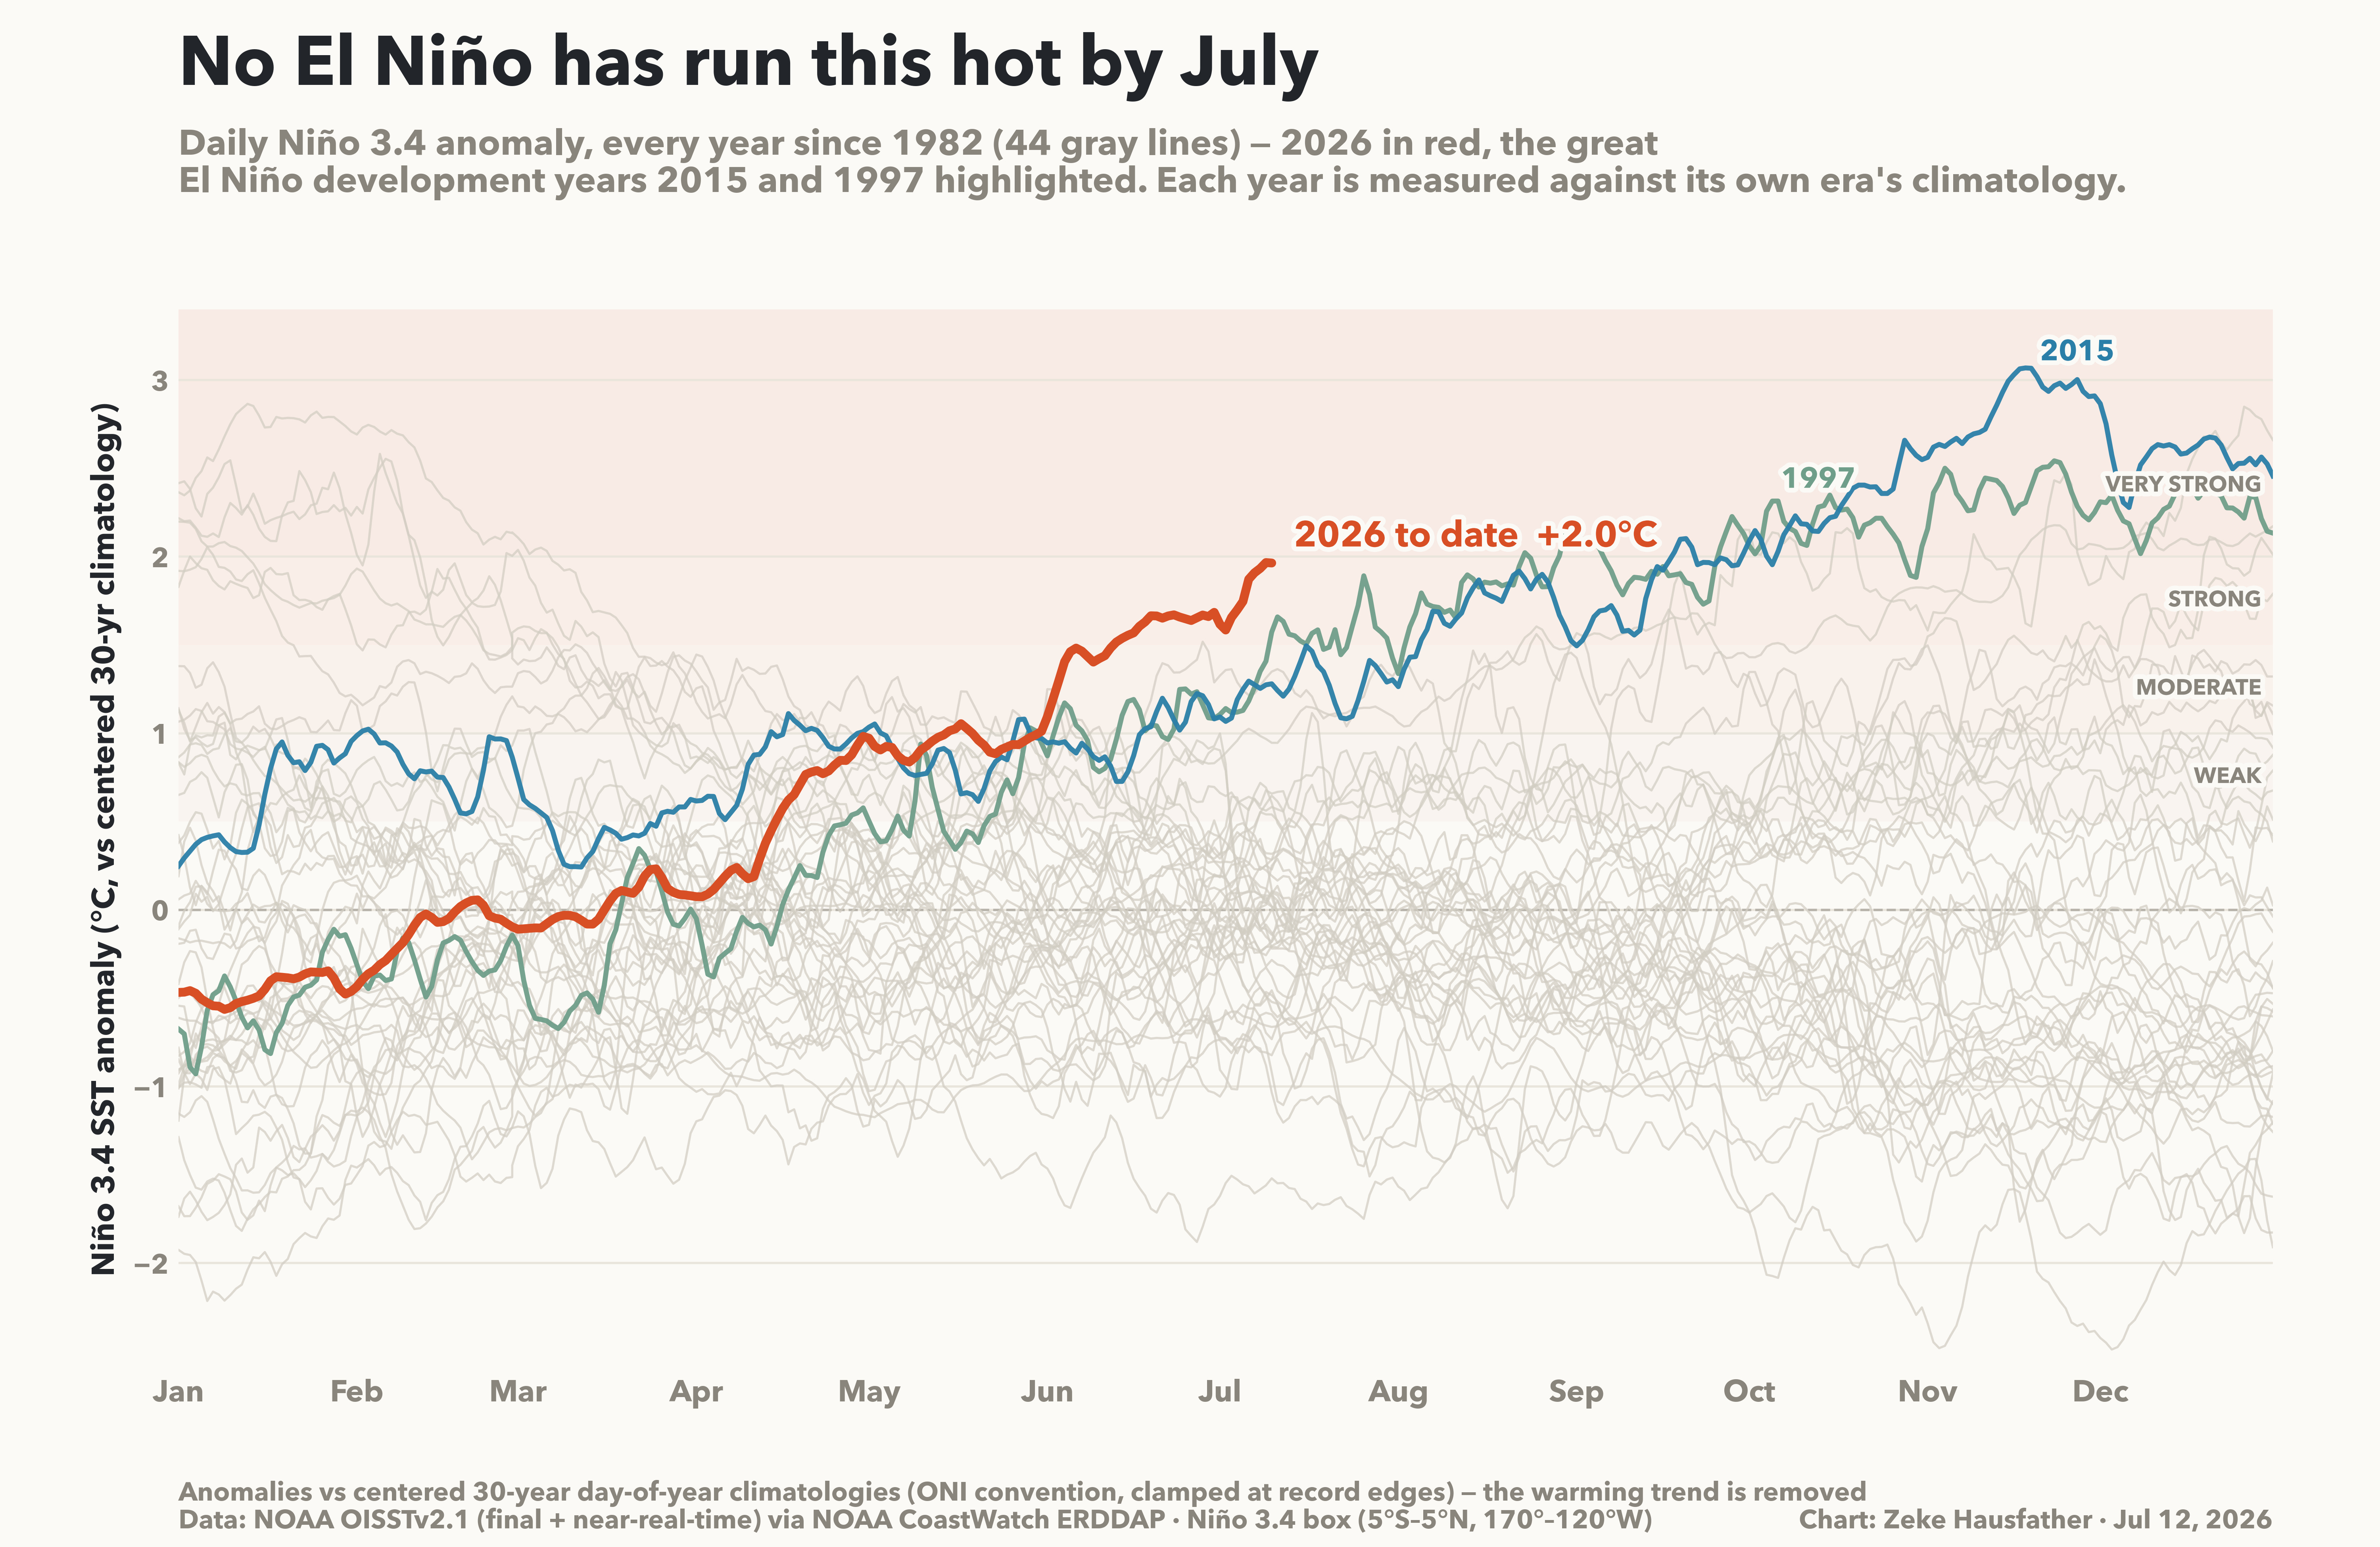
No prior year in the 45-year record has been anywhere near this warm this early: not 1997 (+1.6C at this date), the previous benchmark for an explosive onset, and not 2015 (+1.3C). And El Niño almost always peaks near the end of the calendar year – typically between November and January, occasionally as early as October – so the physics of ENSO’s seasonal phase-locking says there is likely a good deal of intensification still to come.3
What does all this mean for global temperatures? Because global temperature lags ENSO by around three to five months, most of this event’s warming will land in 2027, which is now shaping up to be a genuinely alarming year and the warmest on record by a sizable margin. But a strengthening El Niño does load the dice for late 2026: our dashboard currently gives this year a non-trivial chance (~28%) of edging out 2024 as the warmest on record, up from ~13% at the start of the month..
I want to end with an important caveat about these numbers: the models have never been verified in this territory. Seasonal forecast systems have real, demonstrated skill at this lead time for ordinary events, but no ensemble has ever forecast (and then verified against) a 3.6C El Niño, because one has never happened. Model agreement is reassuring, but it is not proof. But the uncertainties can cut both ways, and the observed ocean, not just the models, is already in uncharted waters.
As always, for daily updates on the El Niño forecast and global temperatures head over to our Climate Dashboard.
I referred to it as “absolutely gobsmackingly bananas” at the time, which might be the only time something I said ever went properly viral online.
The SINTEX-F model is not included in this plot as I only began tracking it in July.
The lone exception in the modern record is the unusual two-year 1986-88 event, which reached its ONI maximum in August 1987. Every other strong event since 1950 peaked between October and January.
Merci pour la mise en situation , mais a part la colère et l'angoisse ressentis que puis-je faire. La réponse égoïste est probablement d'attendre la suite et de remercier le Ciel de ne pas avoir d'enfants à ma charge.
Thank you for your expert assessment, Zeke! I wonder if the La Nina's will be as warm as the old El Ninos soon.