
The El Niño cometh
The latest models show a much greater chance of a strong – or even super – El Nino developing later this year

El Niño and its sister La Niña are the warm and cool phases of a natural climate pattern across the tropical Pacific (collectively called the El Niño-Southern Oscillation, or ENSO). The planet shifts back and forth irregularly between El Niño and La Niña every two to seven years, changing ocean temperatures and disrupting wind and rainfall patterns across the tropics. This in turn has a number of second-order effects around the planet.
El Niño also has a major effect on global temperatures, reducing the rate of ocean heat uptake and increasing atmospheric temperatures. Global mean temperature can temporarily increase as much as 0.2C during a very strong El Niño event, with the maximum temperature increase in global mean temperature occurring around 3 to 4 months after El Niño conditions peak in the tropical Pacific.
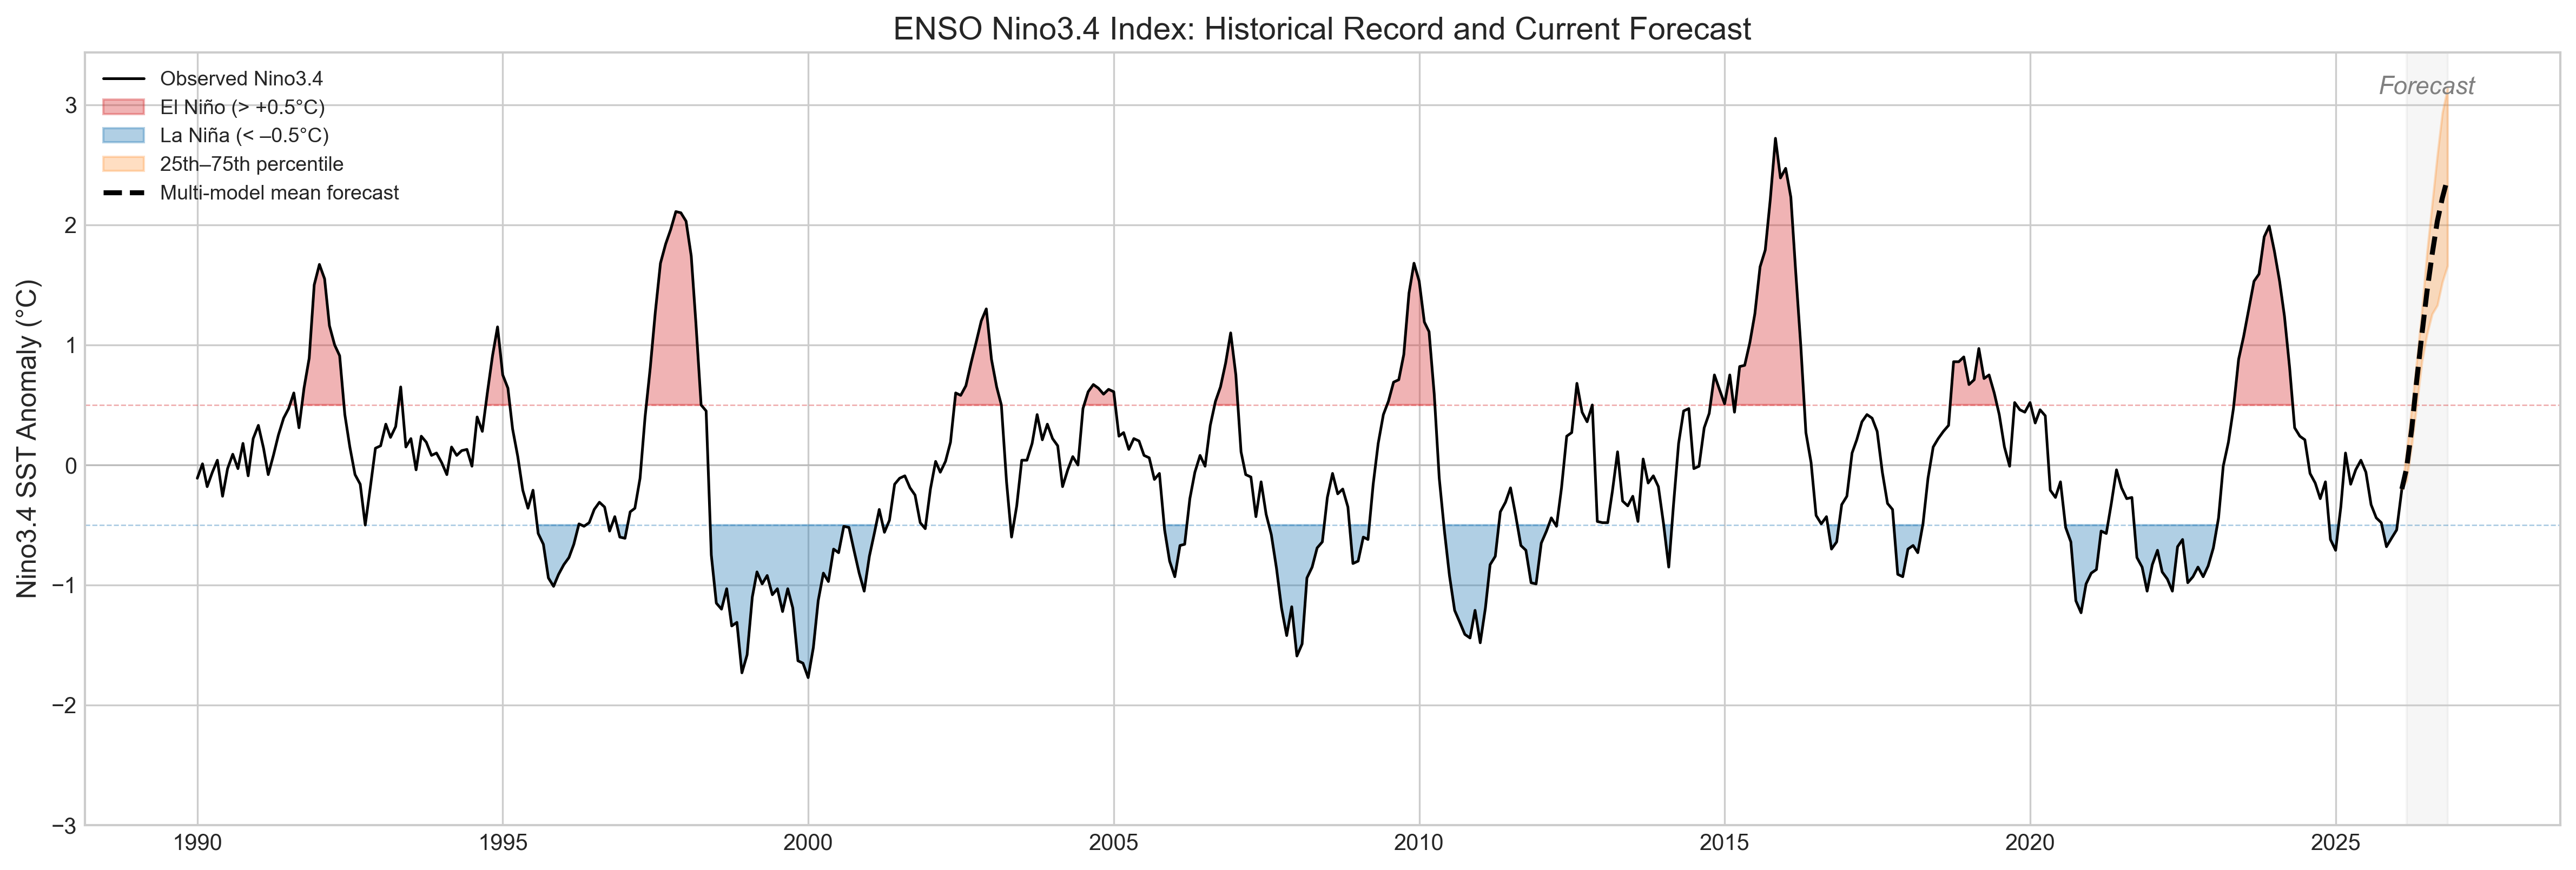
In the past week, a number of modeling groups that try to forecast future ENSO conditions have released forecasts that suggest that a very strong El Niño may be in the works for late 2026. This is a notable revision upwards from earlier forecasts in January and February that suggested that an El Niño might develop, but that it would likely be more modest. Historically it has been hard to precisely predict ENSO development early in the year – hence the famed spring predictability barrier –
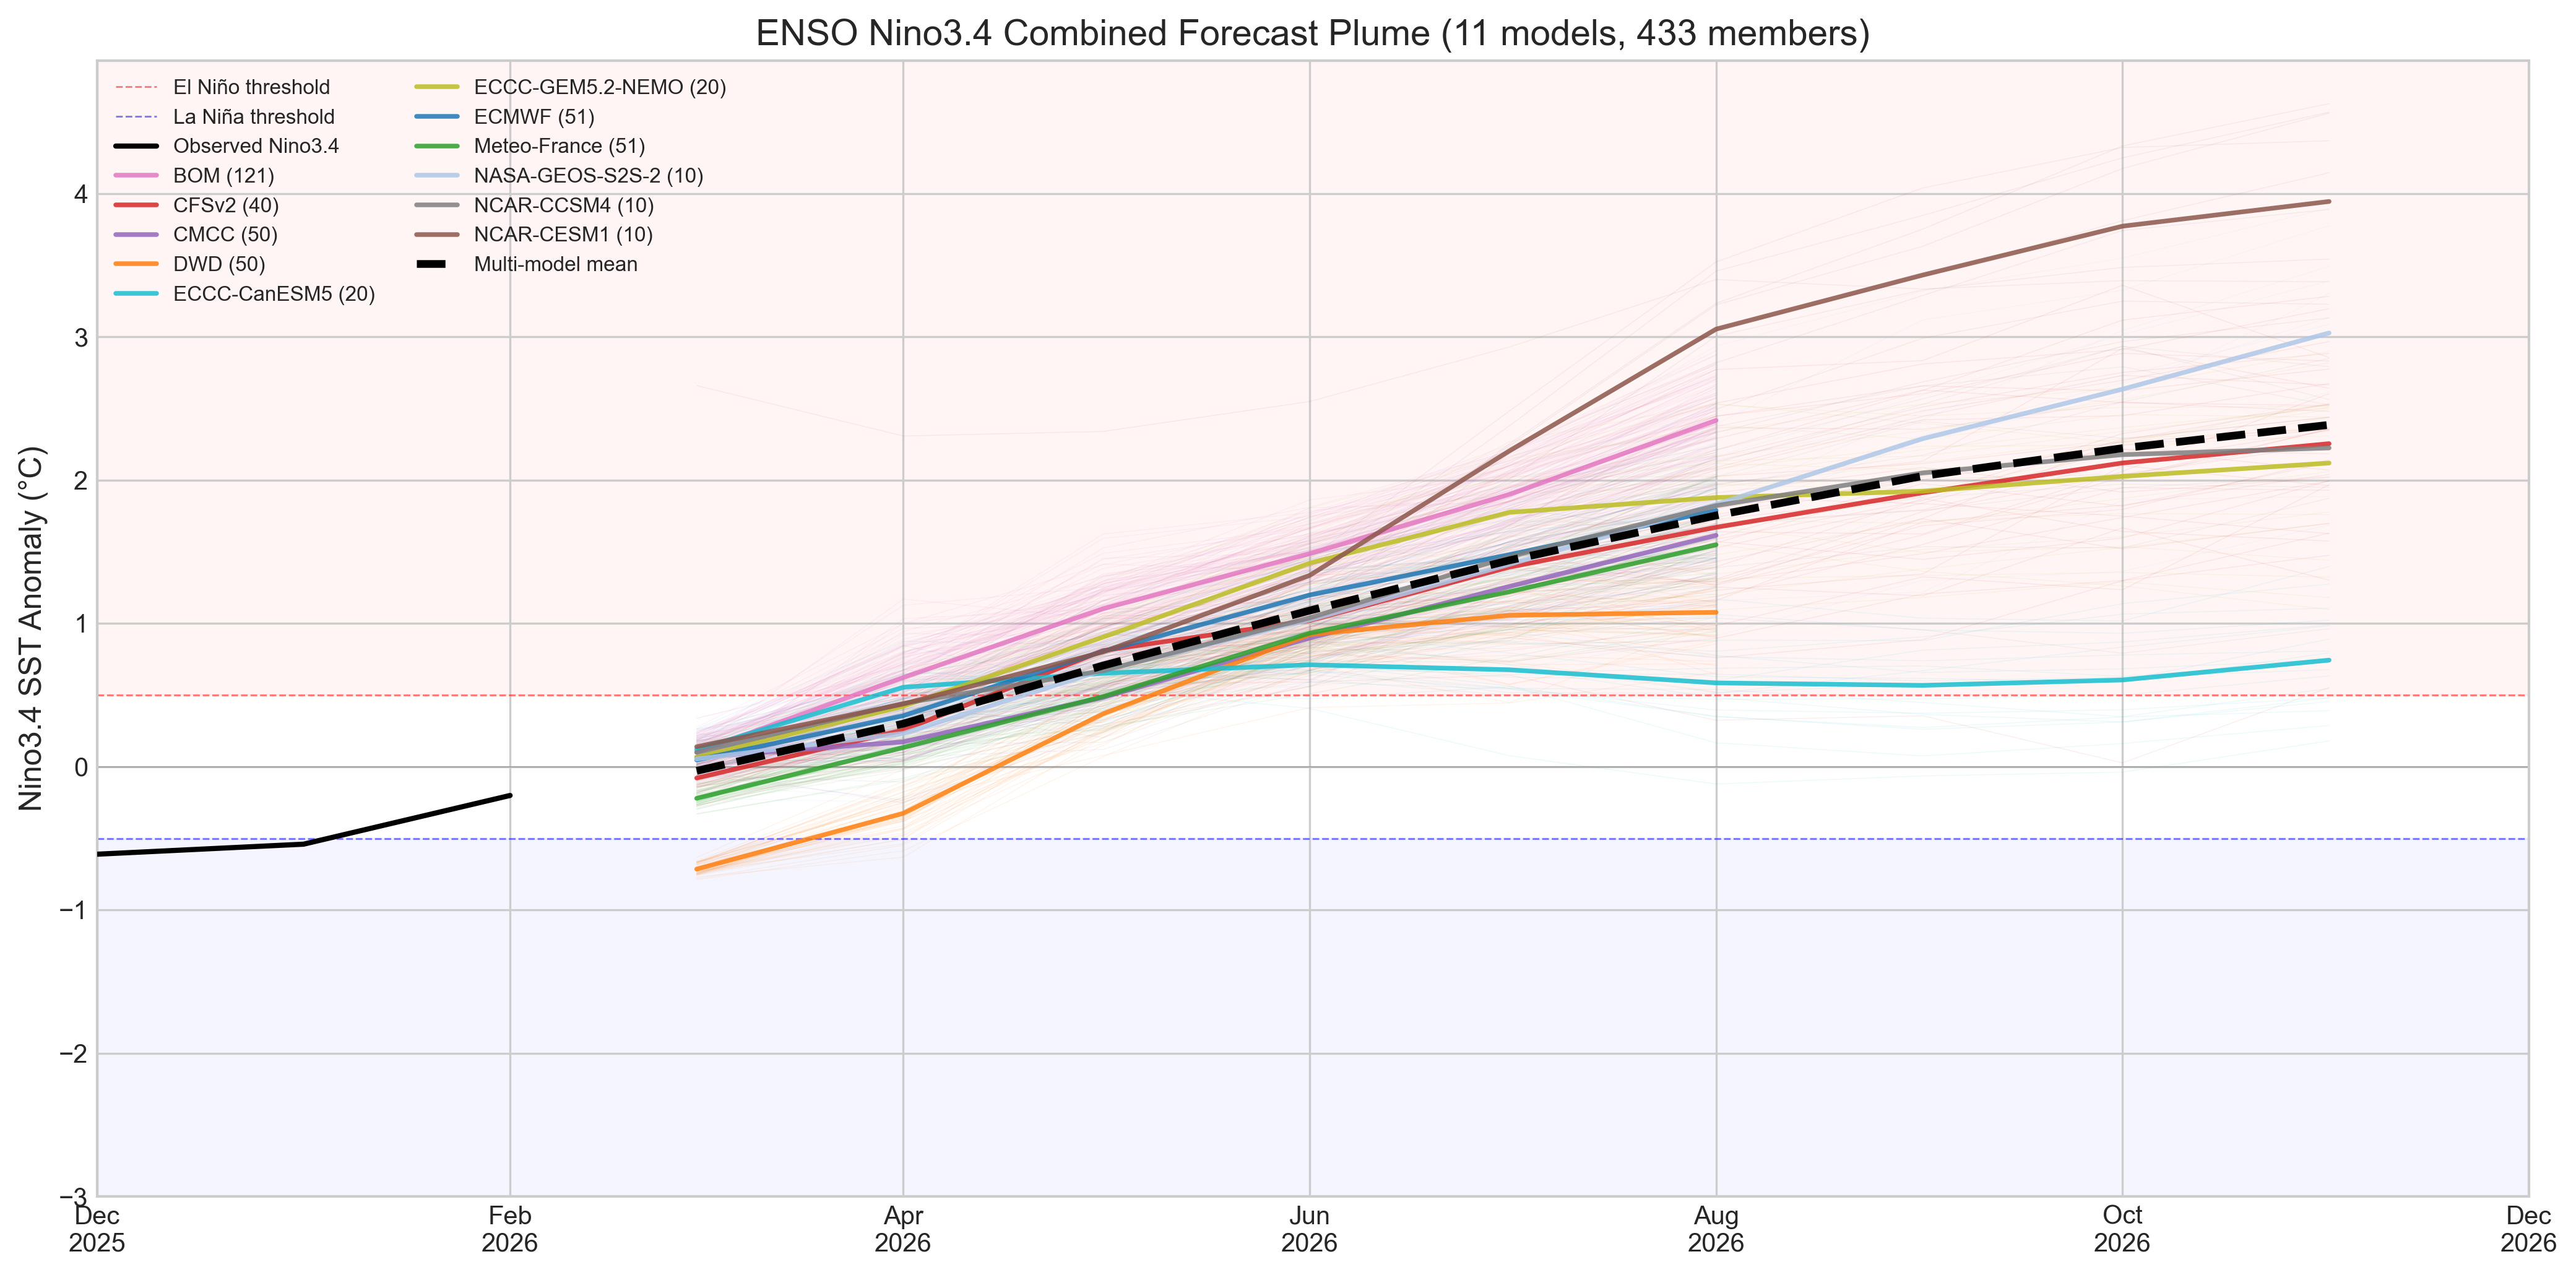
I’ve collected 11 different models that have been updated since the beginning of March. Each of these in turn features a number of ensemble members, so that we end up with 433 total ENSO forecasts. A subset of these obtained from Copernicus’ C3S (from Australia’s BOM, CMCC, DWD, ECMWF, and Meteo-France) only extend through August, while the remainder (CFSv2, ECC-CanESM5, ECC-GEM5.2, NASA-GEOS, NCAR-CCSM4, and NCAR-CESM1) extend all the way through November.
The figure below shows a combined super plume of all the ensemble members of all the models, with the mean of each model shown as a bold colored line and the average of all the models (the multi-model mean) shown as a black dashed line.
We can also look at the distribution of temperatures in each month across all ensemble members. The figure below shows the median, interquartile range (25th to 75th percentile) and whiskers (1.5x the interquartile range) for each month, with the statistics weighted based on the number of ensemble members for each model so that models with more ensemble members do not get more weight.
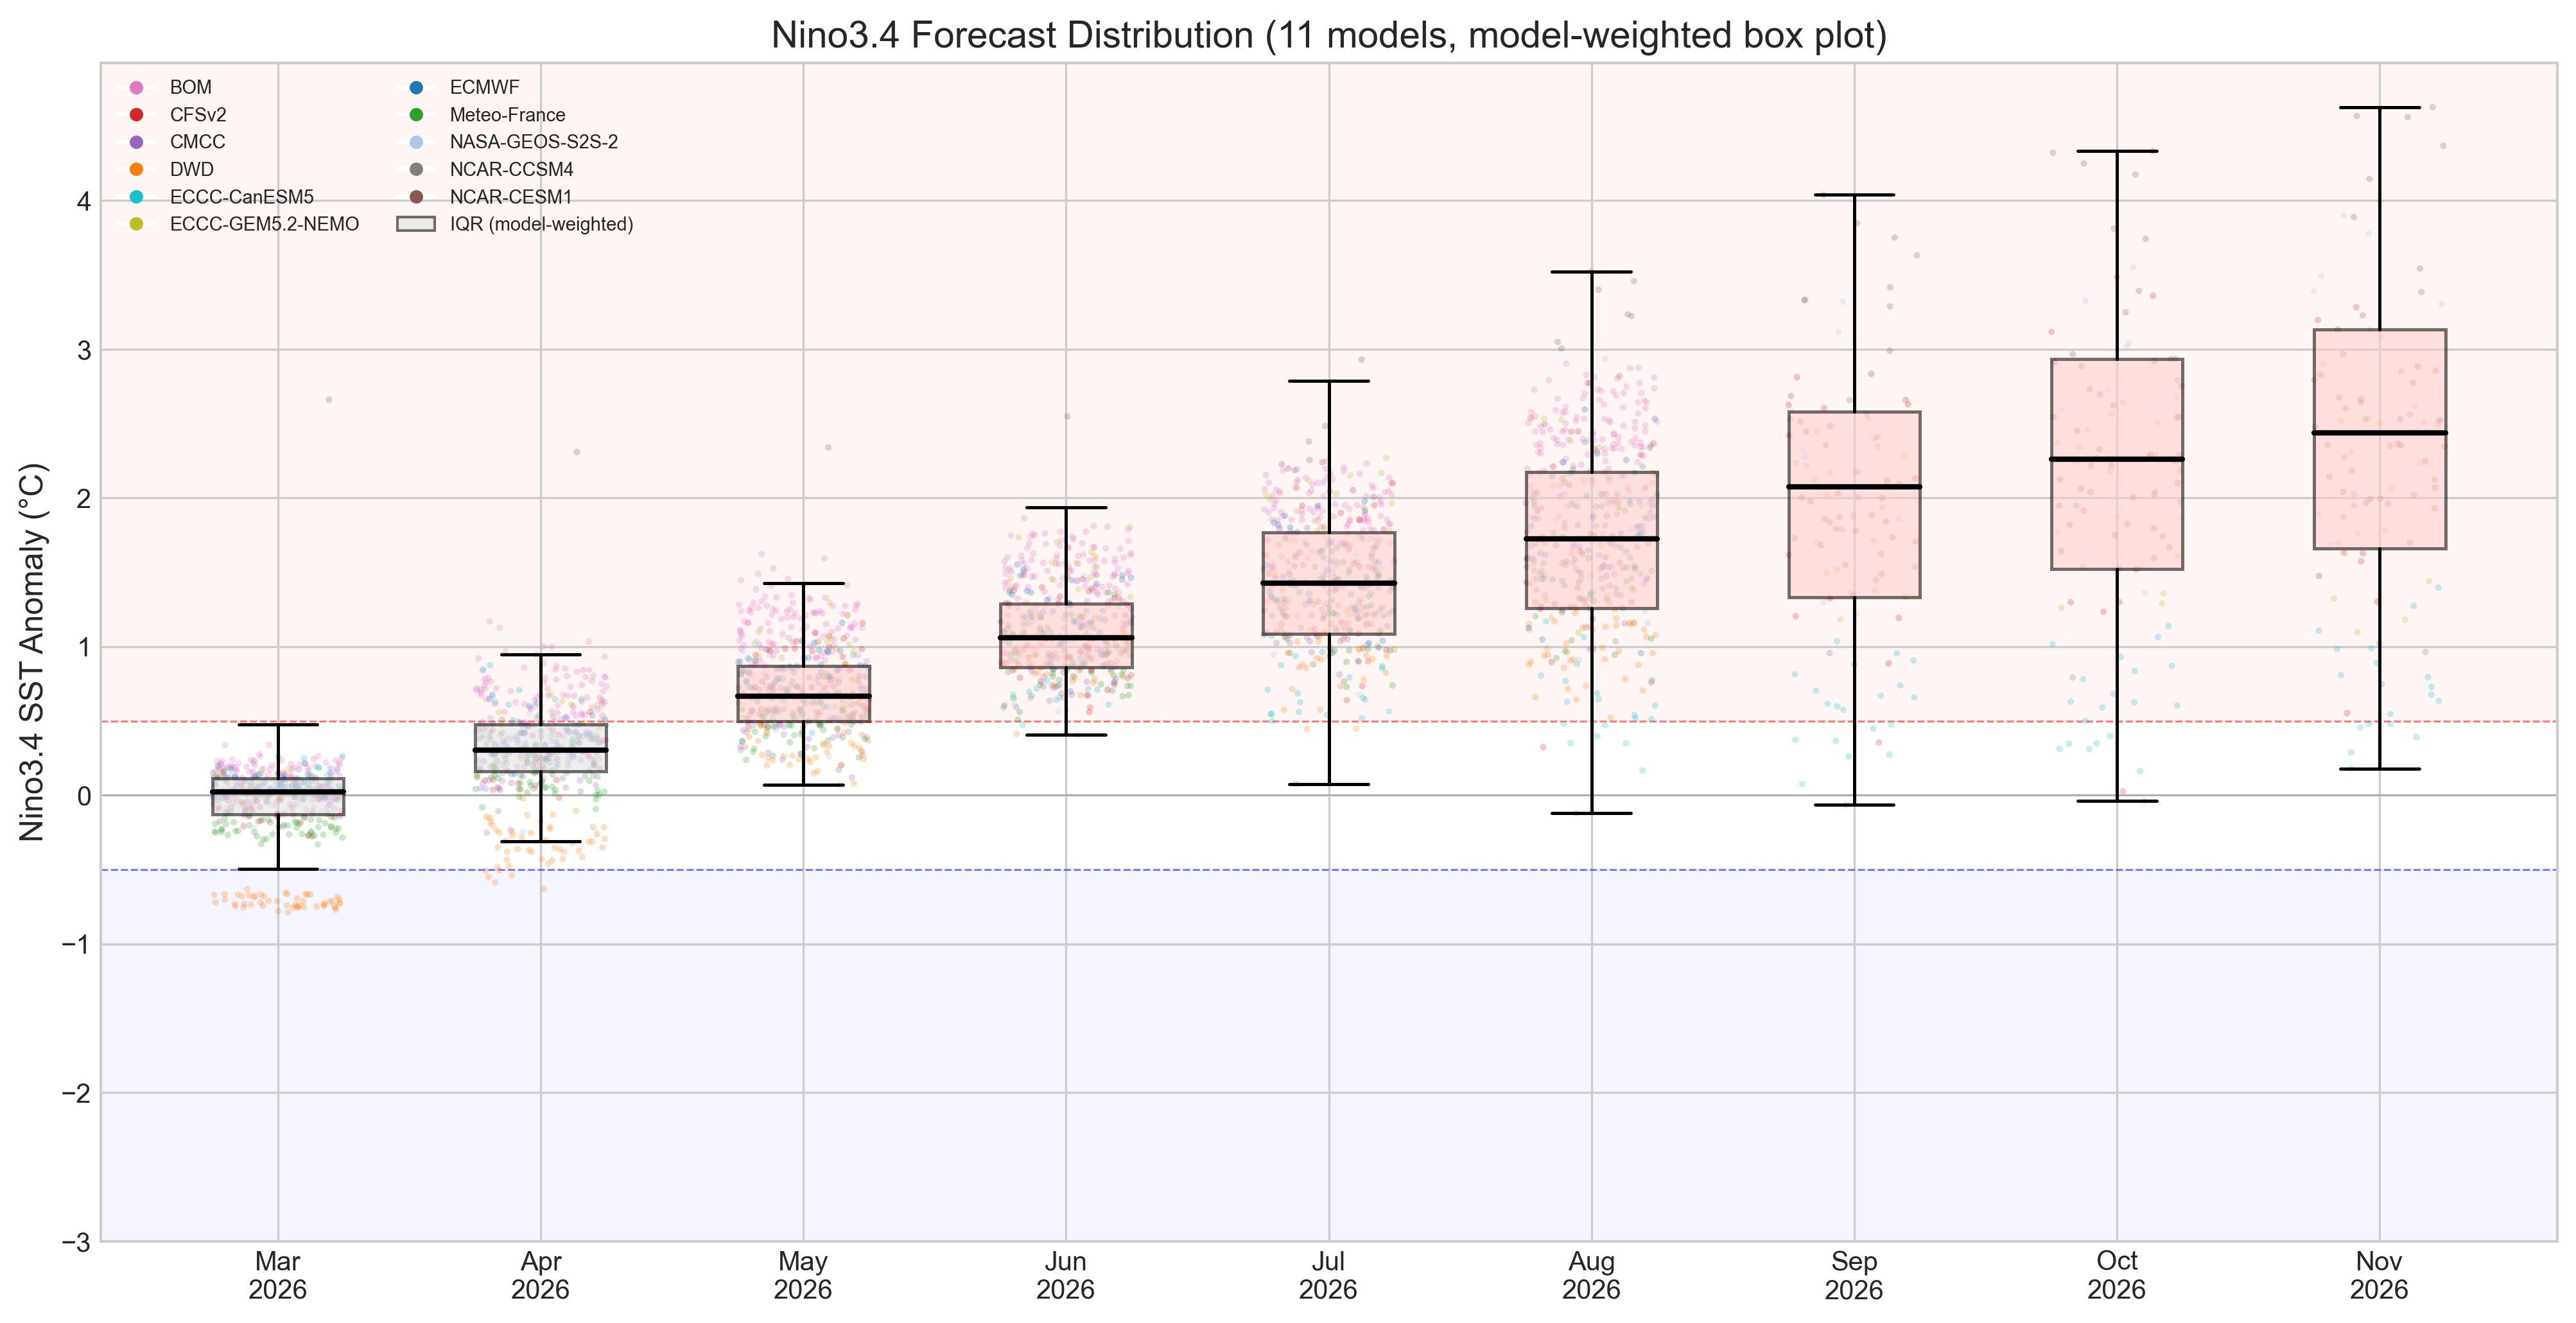
These clearly show that a strong El Niño is indeed likely to develop later in the year. While I’d probably discount some of the higher values (much above 3C) as outliers here, the median and mean across all the models still gives an estimate around 2.5C, which would put it notably stronger than the 2023/2024 El Niño and close to if not matching what we saw back in 2015/2016.1
So what does this mean for global temperatures this year and in 2027? All things being equal, the lag between peak El Niño conditions and the global surface temperature response would result in the largest impacts on 2027 temperatures (as El Niño events generally peak between November and January). It would still boost 2026, but probably not enough to set a new record this year.
However, I have to be a bit cautious here. Long time readers may remember my post in May 2023 where I deemed it unlikely that 2023 would set a new record (given this historical lag in global temperature response to El Niño) and argued that 2024 would instead. I was partially wrong – 2023 was weird, and the heat came much earlier than expected. We think the extended triple-dip La Niña event between 2020 and 2023 may have primed the system for more rapid heating, something absent this time around. But we don’t know for sure. Fool me once, and all that.
Either way, this means that 2027 looks increasingly likely to set a new record, perhaps by a sizable margin if we end up on the high end of the range of El Niño forecasts.
Also, as a bonus, I’ve also added a new permanent tab to our Climate Dashboard where you can see the latest El Nino / La Nina forecasts, and play around with interactive versions of all these charts.
I’d be grateful if you could hit the like button ❤️ below! It helps more people discover these ideas and lets me know what’s connecting with readers.
Note that this shows the old ONI 3.4 Index rather than the new RONI one that better separates out recent global warming from the ENSO signal and has the 2023/2024 El Nino notably smaller. This is because the forecast models still use the old approach to calculating ENSO 3.4 anomalies.
this is such fascinating stuff, yet in somewhat layman's language, so even I can enjoy it. Thank-you SO much for offering it to us......I love following the weather and the why's of it....
Barbara (David)
The enso forecast dashboard with interactive graphs is very nice. The plots, of course, are based on the traditional Nino 3.4, so have a warm bias. Please consider also adding the relative Nino 3.4 to your dashboard. Great work!