

A few days ago, on an atmospheric sciences mailing list, Prof. Gary Lackmann pointed out that August 2026 set a record for the amount of water vapor in the atmosphere. I thought this was right in TCB’s wheelhouse, so I’ve dug further into the numbers in this post.
What does “precipitable water” mean?
Precipitable water (abbreviated PWAT) is the water in the atmosphere that’s available to condense and fall as rain or snow. We quantify it by calculating how deep a puddle it would make if you condensed all of the water vapor in the atmosphere and rained it to the surface. The value is typically reported in millimeters.
Here is the average PWAT over the 1991–2020 period. The global average is about 24 mm, enough to make a puddle about an inch deep.
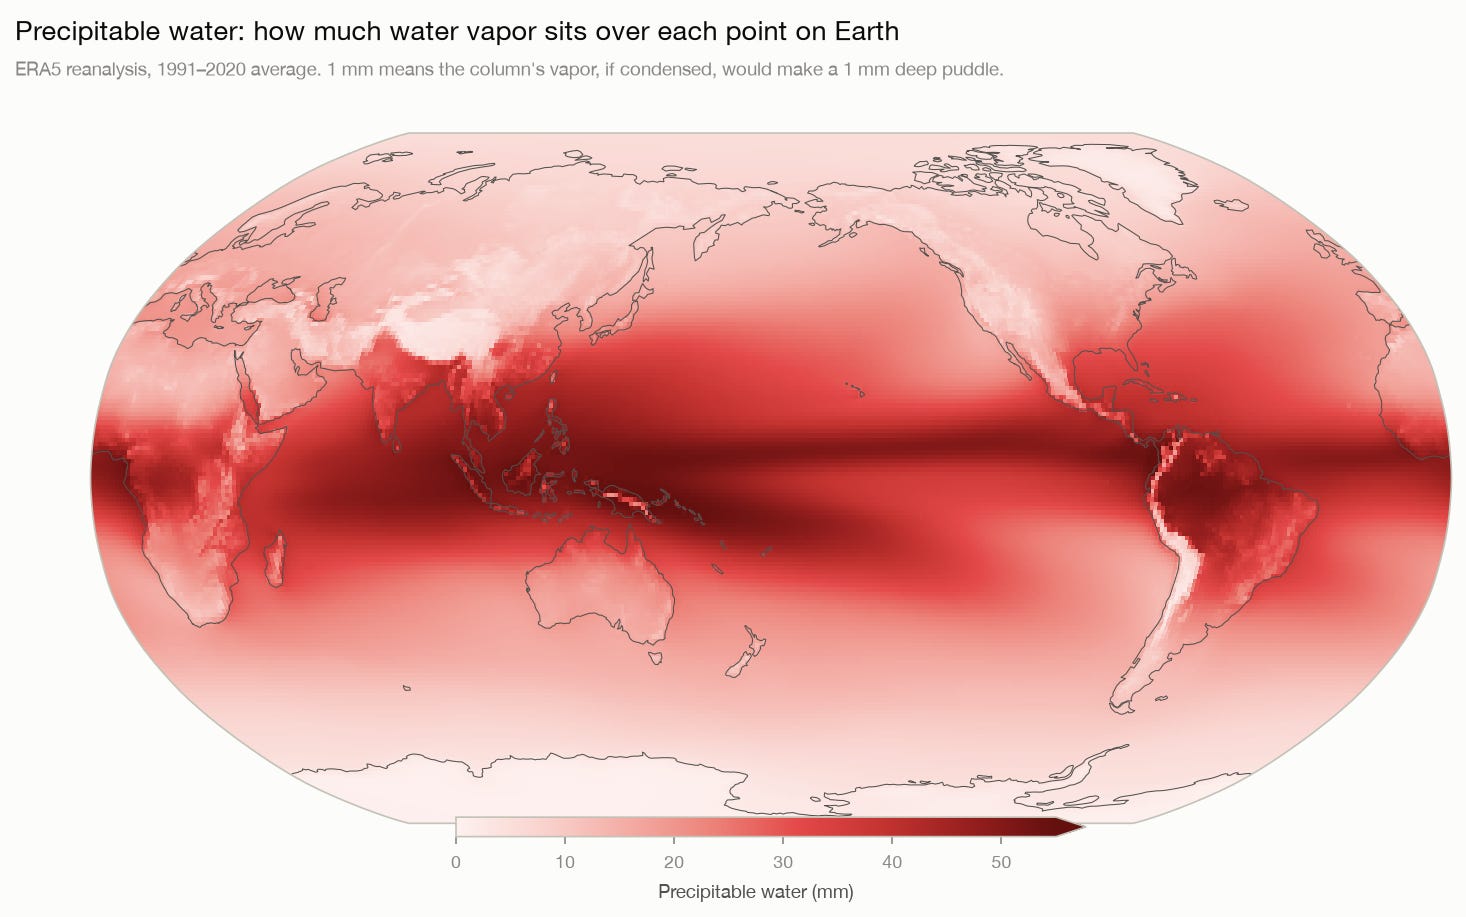
The distribution of PWAT follows the distribution of temperature. The reason is thermodynamics: the amount of water vapor that air can hold increases by roughly 7% for every degree Celsius of warming, following the Clausius–Clapeyron relation. The result is high PWAT in warm tropics and low PWAT in cold polar regions.
It is increasing
The planet has been warming, so you might expect that the PWAT should also be rising. Indeed, this is what we see. Here is global-mean PWAT for every August since 1979.
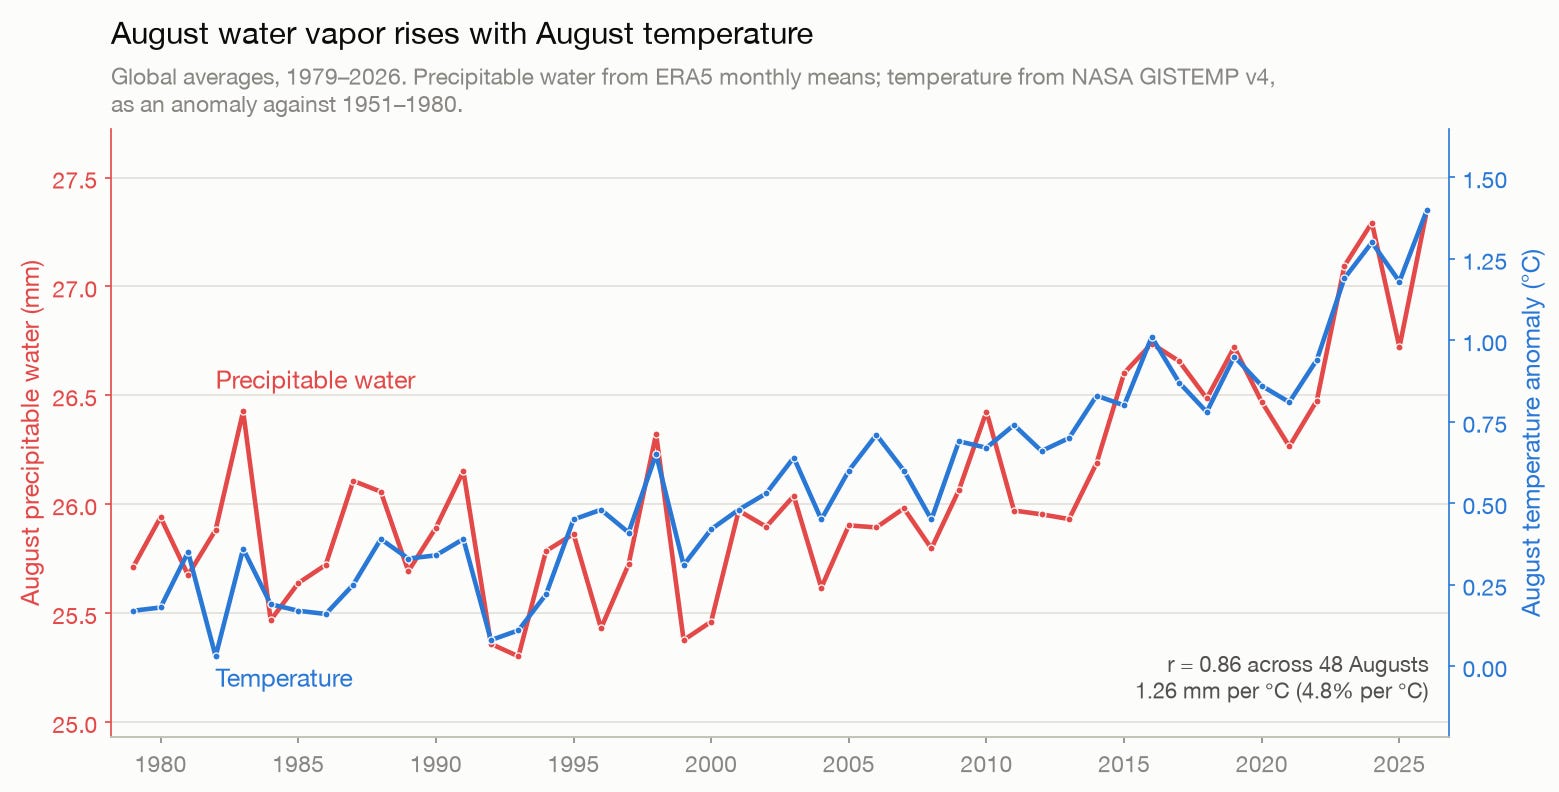
Also plotted is the August global average temperature; it’s also going up. In fact, we see the expected correlation (r = 0.86) between PWAT and temperature.
August 2026’s PWAT was 1.5 mm above the average PWAT in August of the 1980s, a difference of 5.8%. This is in the ballpark of what we would expect given the ~1°C of global average warming over this period.
We’re #1
A few days ago, news came out that August 2026 was the hottest month in the last 170 years. Yup, climate change strikes again (with an assist from El Niño).
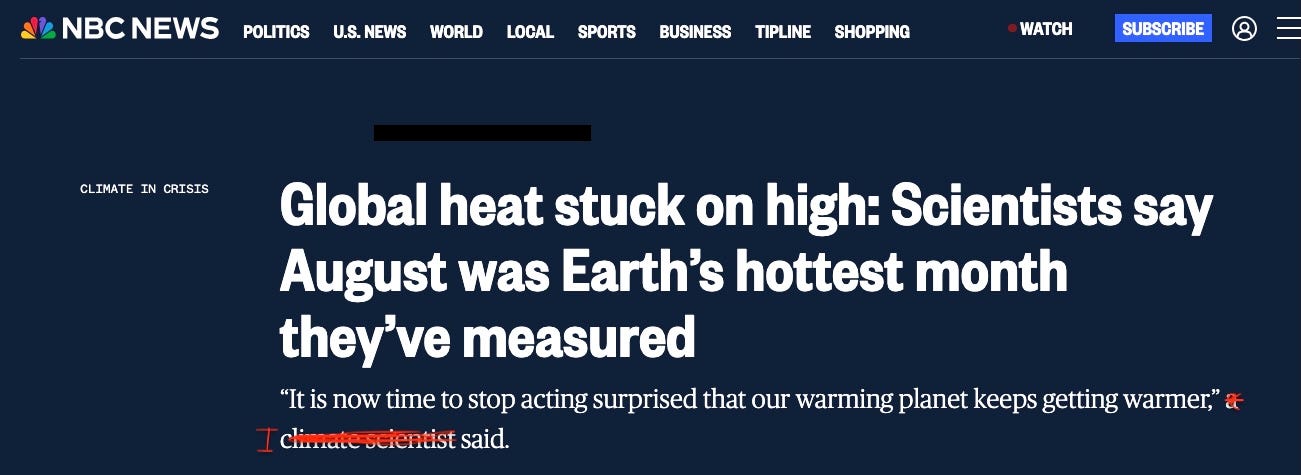
Therefore, it might not be too surprising that August 2026 also set a record for PWAT, 27.35 mm, beating the previous record (July 2024) by 0.04 mm1.
The data I analyzed only goes back to 1979, but given the very strong connection between PWAT and temperature, it is unimaginable that any month in the last few thousand years, maybe 100,000 years, has more PWAT in the atmosphere than August 2026. We are, as the proverb says, living in interesting times.
Why this matters: extreme rain
PWAT is one of the most important factors that controls the intensity of rainfall. In particular, we expect increases in PWAT to increase the frequency or intensity of extreme precipitation events. This has been confirmed in data. For example, Kunkel et al. (2020) concluded:
An analysis of 3,104 stations in the United States shows virtually every station exhibits a positive correlation between precipitable water (PW) and extreme daily precipitation (EP) with over one-third statistically significant.
In Trenberth et al. (2003), the authors state:
We have argued that because heavy rainfall rates greatly exceed evaporation rates and thus depend on low-level moisture convergence, then the rainfall intensity should also increase at about the same rate as the moisture increase, namely 7% per K with warming.
The IPCC AR6 report says:
In summary, precipitation extremes are controlled by both thermodynamic and dynamic processes. Warming-induced thermodynamic change results in an increase in extreme precipitation, at a rate that closely follows the C-C [Clausius–Clapeyron] relationship at the global scale (high confidence).
So the increase in PWAT is not just a weirdo statistic. It is a statement about the ceiling on the worst rain events we can face.
July 4 flooding
As an example of a real-life case, let’s consider the flooding in Texas on July 3-4, 2025. This tragic rain event caused flooding that claimed the lives of more than 130 people, including 27 campers and counselors at Camp Mystic.
The PWAT over Texas for that event was incredibly high. Here is a plot of the percentile rank of PWAT at 2 am CDT on July 4, 2025.
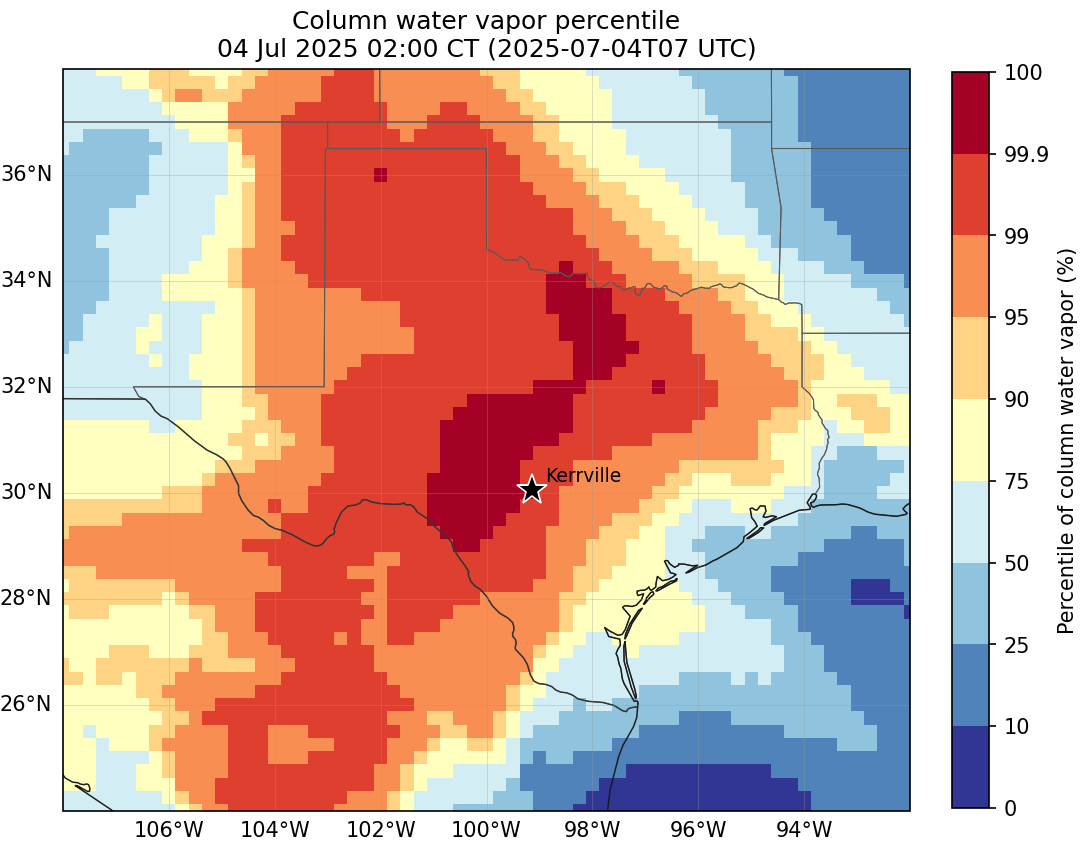
Most of the state has PWAT above the 95th percentile, with a large plume of moisture in the middle of the state exceeding the 99.9th percentile. Here is a histogram of PWAT for the grid point closest to Kerrville:
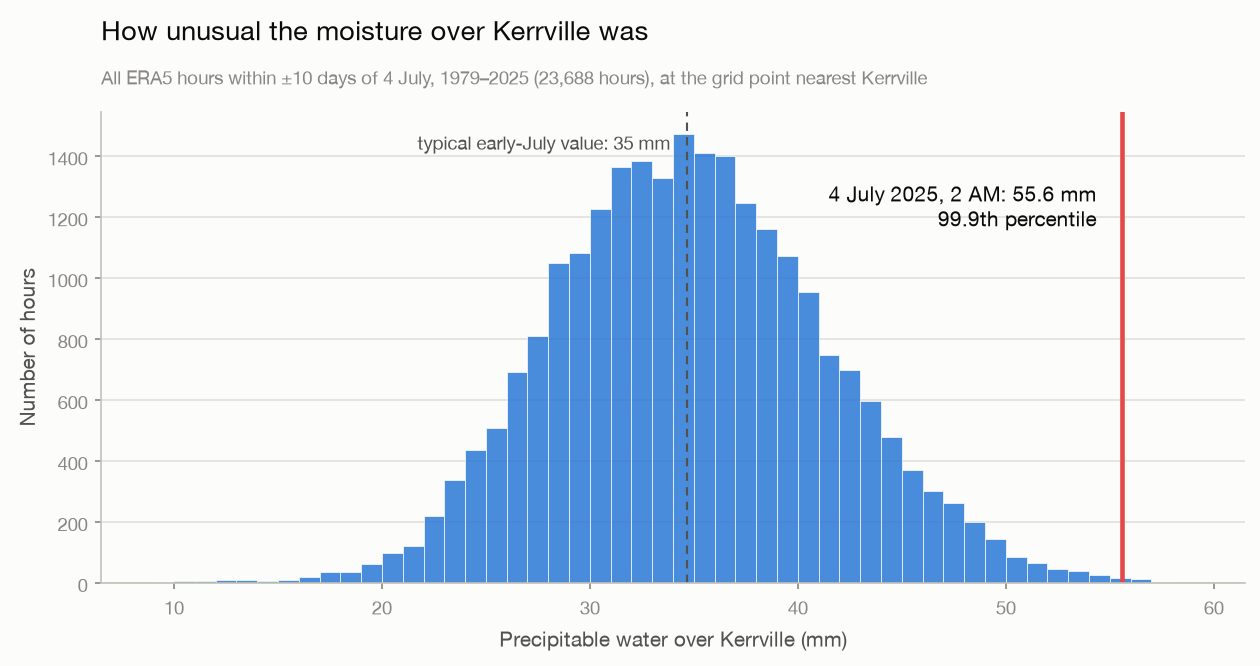
PWAT over Kerrville was 55.6 mm, about 60% higher than a typical early-July value of 35 mm. Out of 23,688 late-June/early-July hours over 47 years of data, only 23 hours were moister.
It is inarguable that the high PWAT contributed to the extreme rain of this event. Given that we can connect increases in PWAT to global warming, we can confidently conclude that climate change made this rain event more intense than it otherwise would have been.
The bottom line
The atmosphere holds more water vapor than it used to because it is warmer than it used to be. August 2026 saw the highest water vapor levels in the modern record due to the extreme warmth from climate change and the El Niño. This trend is not going to stop as long as we’re dumping carbon into the atmosphere and it’s going to contribute to more and more intense rain events.
Code for the plots in this post can be found here.
I’d be grateful if you could hit the like button ❤️ below! It helps more people discover these ideas and lets me know what’s connecting with readers.
That doesn’t sound like much, but it corresponds to about 5 trillion gallons of water.
Grab the oars!
Interesting post. A couple questions, if you don’t mind:
Is PWAT going to be related linearly with specific humidity?
Are there public-domain datasets for PWAT?
Thanks!