


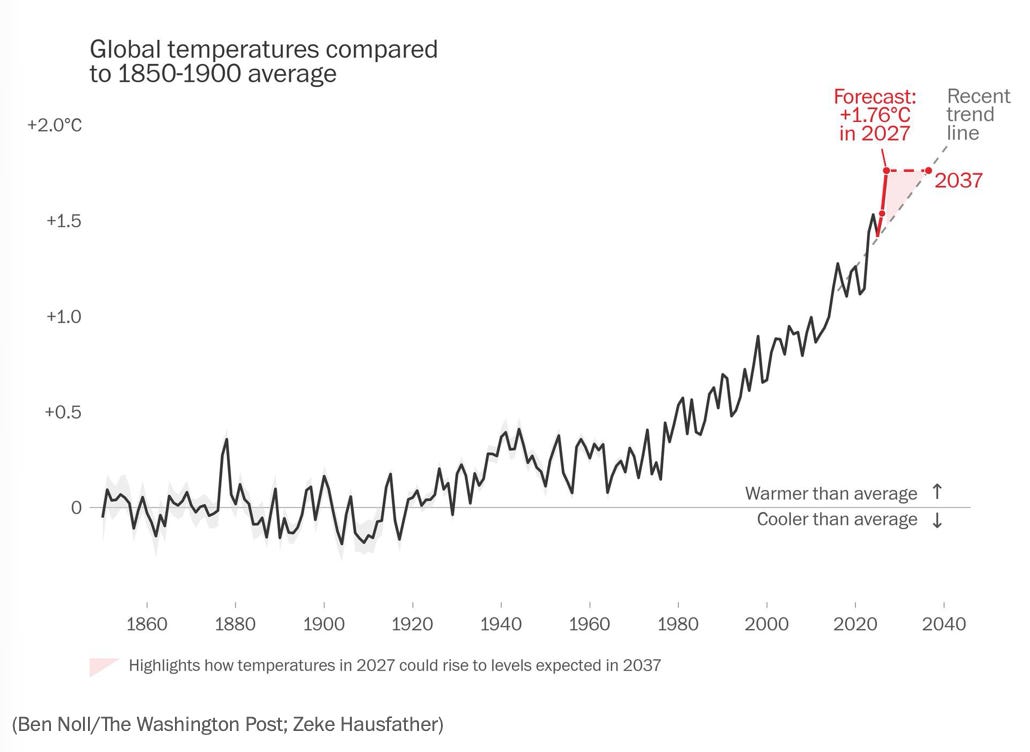
Global temperatures are predicted to soar due to the El Niño event that is currently ramping up. Most forecasts predict that 2027 will set records, with the global average temperature reaching levels we would not expect until the late 2030s.
To what extent does this upcoming El Niño give us a preview of what the climate will be like a decade or two from now?
What is El Niño?
Here’s what one of us (AD) wrote in his climate textbook:
The best-known example of unforced variability in our climate is the El Niño/Southern Oscillation (referred to by scientists as ENSO). El Niño events, which make up the warm phase of ENSO, occur every few years and last a year or so, and alternate with cooler La Niña events. These ENSO events are associated with large-scale shifts of rainfall and temperature patterns around the globe, and these have enormous consequences for humanity. Some regions see more rainfall during an El Niño, and some see less; some regions experience warmer temperatures than normal, while others are cooler.
Here’s something Kevin Trenberth wrote about ENSO (from a not-yet-published article):
ENSO is the dominant mode of interannual climate variability. It is a natural phenomenon arising from coupled interactions between the atmosphere and ocean in the tropical Pacific Ocean. El Niño events occur roughly every two to seven years and each event has its own character. Surface tropical winds create changes in sea temperatures that determine where the main tropical convection and storm activity occur, and thus further change the winds.
ENSO redistributes heat and moisture around the globe and regulates temperatures in the tropical Pacific Ocean, which cools mainly from increased evaporation. The added atmospheric moisture is realized in rainfall and as latent heat in the atmosphere, which contributes to a general warming of the global atmosphere and global mean surface temperature that peaks a few months after a strong El Niño event. ENSO underpins seasonal climate prediction, and has major impacts and strongly influences ecosystems, economies, and society.
For a more detailed explanation of ENSO, watch this video from the UK Met Office:
The global picture
This figure from AD’s textbook shows global average temperature measured by satellite and color coded by phase of ENSO. It is clear that, when you are in an El Niño, the Earth’s global average temperature rises dramatically:
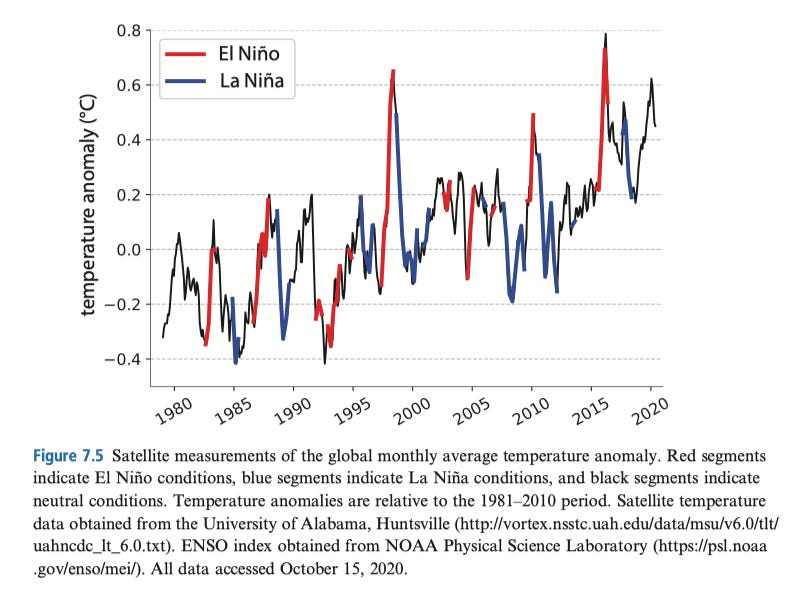
Thus, from a global average perspective, the framing of “El Niño is a time machine” is correct. Indeed, one of us (ZH) has been using this analogy to try and explain 2027’s El Niño-fueled global average temperatures, which may equal what the long-term trend predicts the temperature of 2037 will be.
The catch
The catch is that the future world that has been warmed by greenhouse gases and a present-day world that has been temporarily warmed by El Niño can have the same global-average temperature while having significant differences in the impacts of this warming.
The reason is that the two kinds of warming come from different physical processes. Greenhouse-gas-driven global warming (hereafter, GHG warming) results from greenhouse gases trapping heat that would otherwise escape to space, leading to an accumulation of energy in the Earth system, which in turn leads to increasing temperatures.
El Niño is different. To a first approximation, it is better thought of as a redistribution of heat already in the climate system. During El Niño, changes in winds in the tropical Pacific allow warm water that had been stored below the surface in the West Pacific to spread eastward and warm the surface. That warming then propagates to the rest of the planet.
Those different mechanisms leave very different fingerprints.
Temperature
Here is the pattern of long-term warming, calculated from Berkeley Earth data:
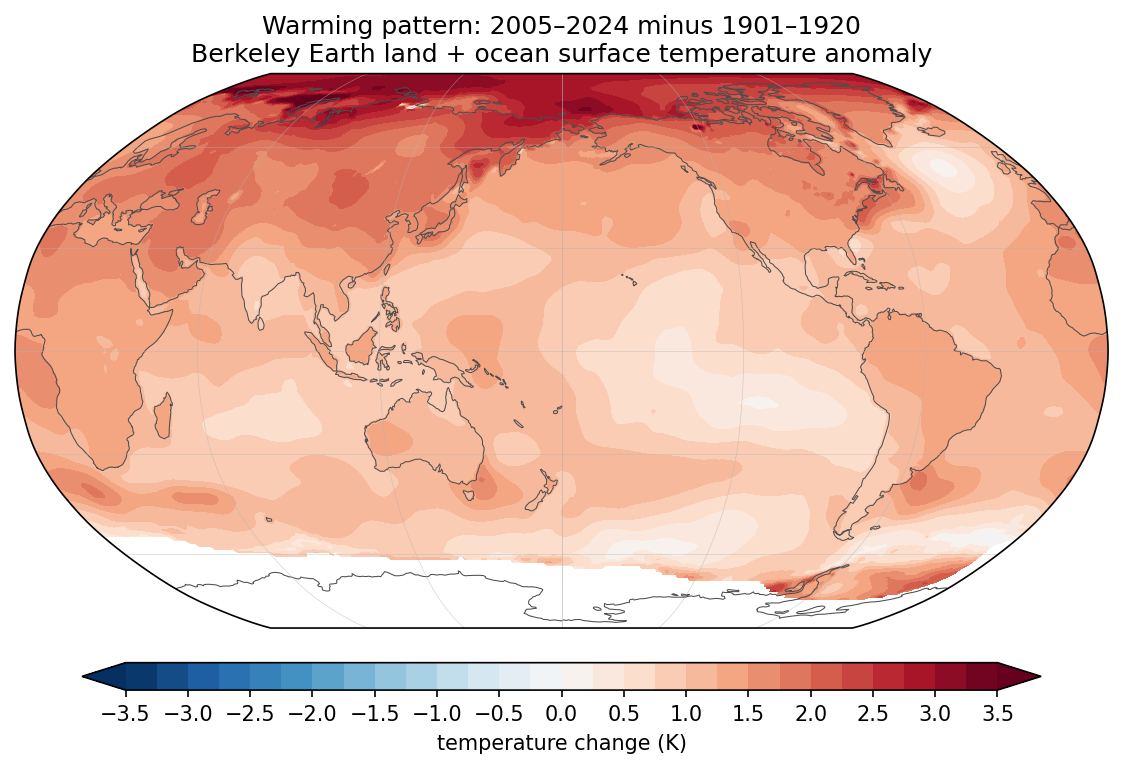
The first thing to notice is that greenhouse warming really is global warming. Almost every spot on the planet is experiencing long-term warming. There are well-understood spatial variations in the rate of warming: e.g., land has warmed faster than the oceans because of water’s high heat capacity.
Any individual year, of course, will not look like this because a single year’s pattern is the combination of GHG warming and random variability from ENSO and an alphabet of other modes of variability (PDO, NAO, etc.).
The strength of an El Niño is measured by the average temperature in the tropical Pacific (the black box in the figures below), which we refer to as the ENSO index, with units of degrees Celsius.
We can regress the global average temperature against the ENSO index, which tells us that the globe warms about 0.08°C for every degree increase in the ENSO index. The forecast is for the ENSO index to reach +3.9°C in November 2026, which implies approximately +0.3°C of (temporary) global warming in the following year1. This additional ENSO warming is the reason that 2027 will be a record breaker and a preview of a greenhouse-warmed world of the late 2030s.
We can also estimate the spatial pattern of the global warming due to El Niño by regressing the ENSO index against the temperature at each grid point (at two lags, zero and 6 months):
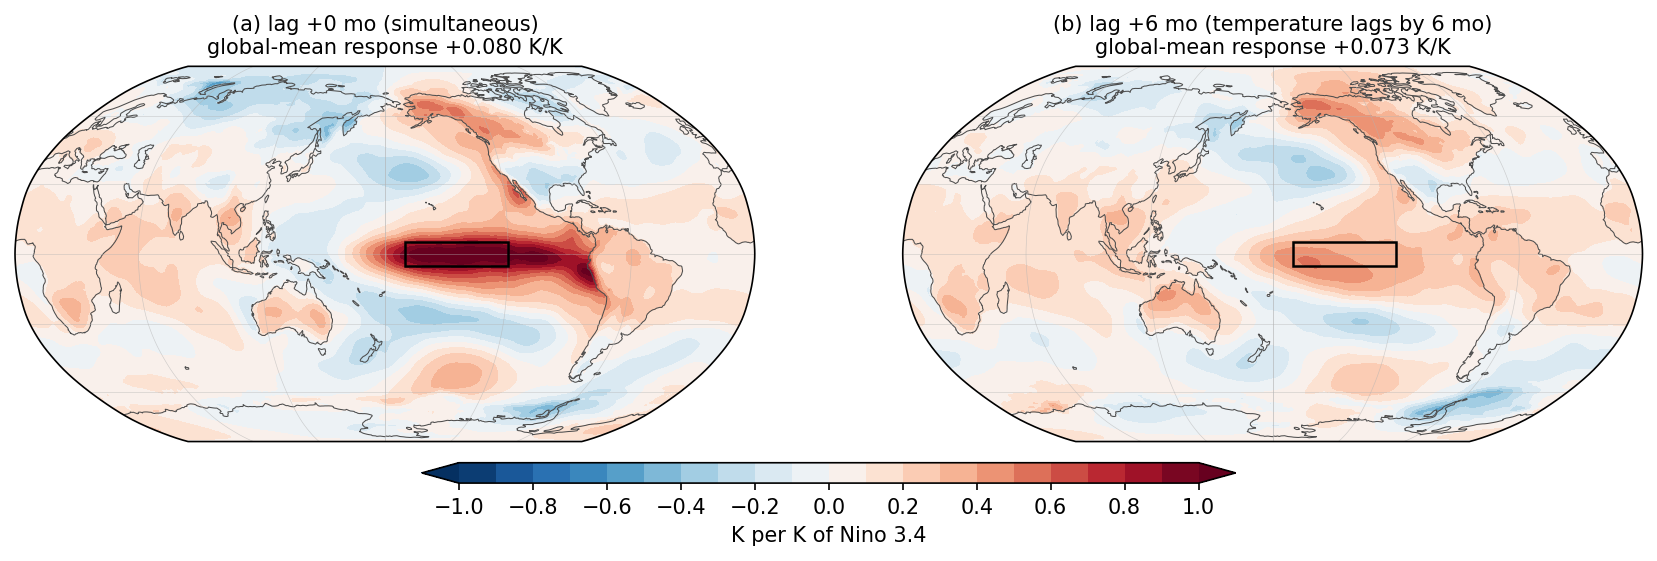
As you can see, the El Niño warming pattern is very different than the GHG warming pattern. It is definitely not global; instead, a large fraction of the warming occurs in the tropical Pacific. And some regions actually cool during an El Niño.
So while the global average temperature in 2037 may equal that of 2027, the warming will be distributed differently. You should therefore not expect your local conditions in 2027 to equal your local conditions in 2037.
Precipitation
As temperatures shift in response to an El Niño, the distribution of rainfall also shifts.
Observational records of precipitation aren’t as good for this type of calculation, so for these plots I am using ten members of the CESM1 Large Ensemble. Here is the long-term change in precipitation between the early 20th century and the late 21st century:
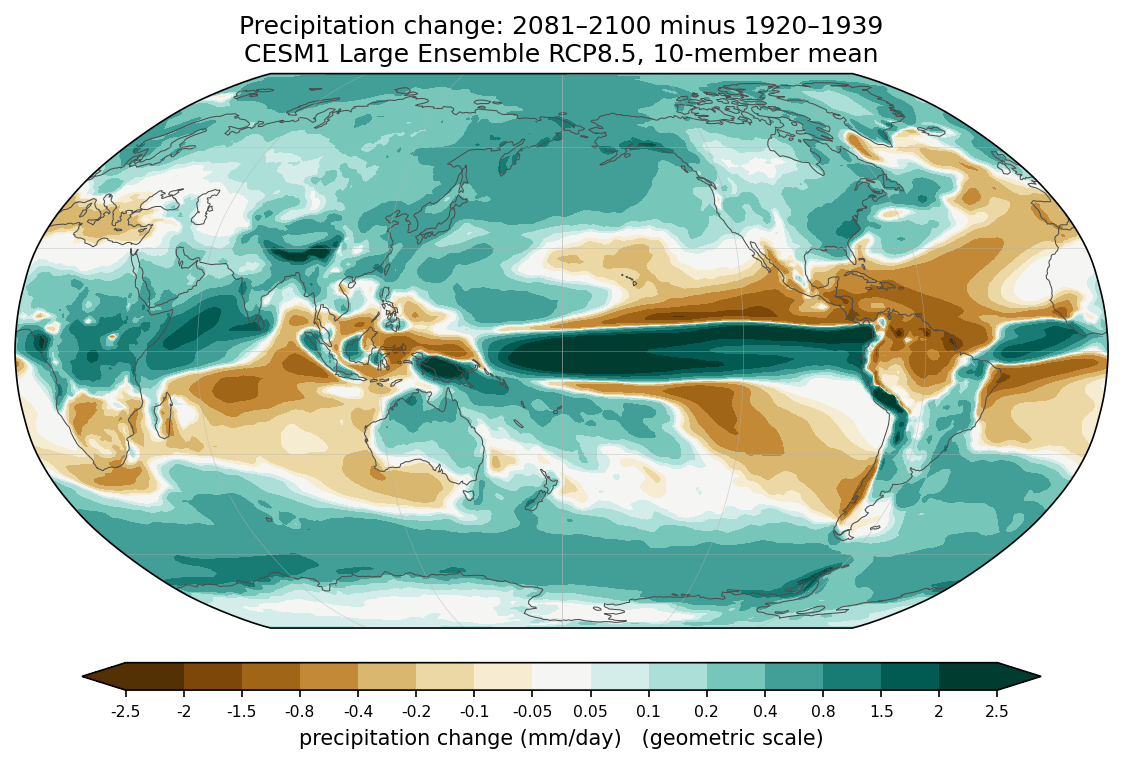
There is a broad increase in global precipitation, which makes physical sense. Surface energy balance requires evaporation to increase as the globe warms, so precipitation, which must balance evaporation, must also increase.
But, as with temperature, the increase is not distributed evenly. Some regions will see very large increases in precipitation while others get drier. Many of the drying regions are in the subtropics, including parts of the Mediterranean, southern Africa, Australia, and the Americas.
Now compare that with the rainfall response to El Niño, calculated the same way as the temperature response above:
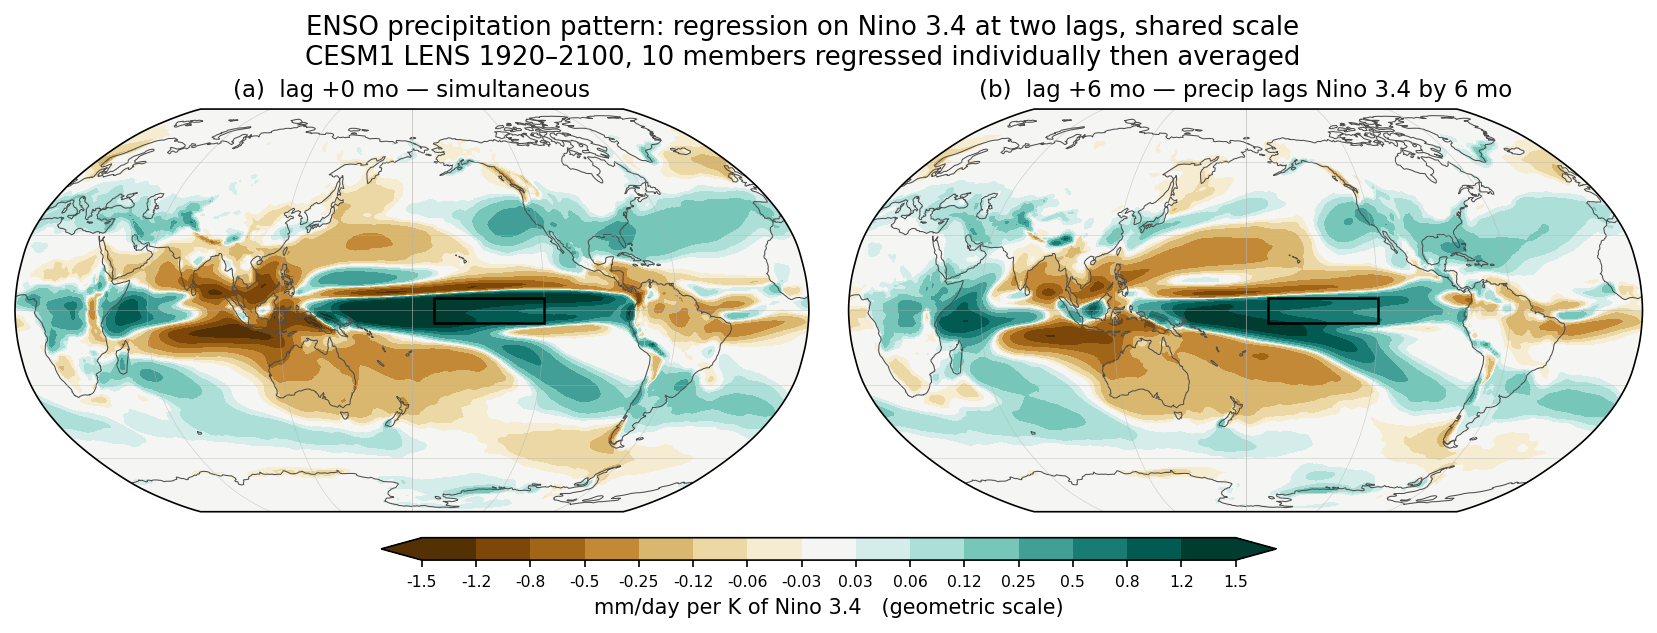
There are similarities between the responses to GHG warming and ENSO — but also important differences, particularly at high latitudes and in the tropics.
Other differences
The differences extend beyond temperature and precipitation. For example, consider hurricanes. During an El Niño, the distribution of hurricanes changes in significant ways:
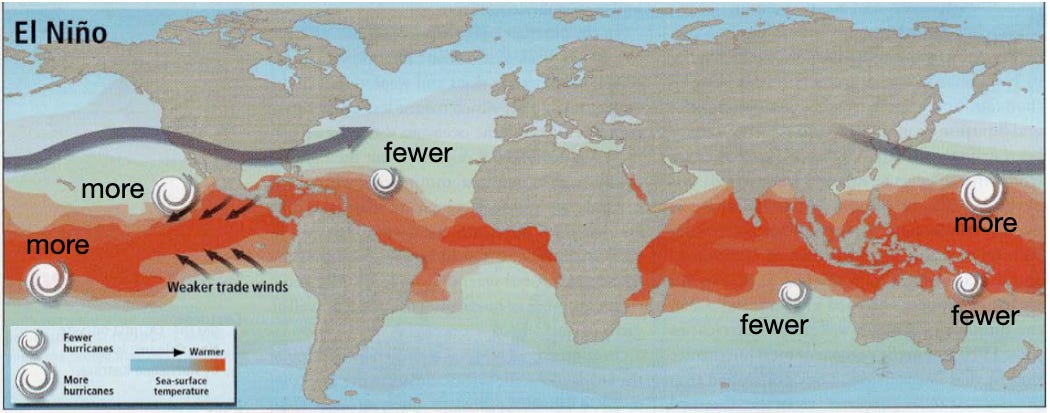
Thus, a future greenhouse-warmed climate of 2037 with exactly the same global-average temperature as 2027 but in an ENSO-neutral state (neither El Niño nor La Niña) would be expected to have more Atlantic hurricanes than El Niño-enhanced 2027 would.
The same logic applies to droughts, floods, heat waves, and many other climate impacts.
So is El Niño a preview of the future?
Yes, in a limited sense.
The coming El Niño may temporarily push global-average temperatures to a level that will not occur during (ENSO-neutral) conditions for another decade or two. In that sense, it really is a glimpse of the future.
But it is not a true time machine. It does not provide a full picture of what the Earth will actually look like a decade hence.
The future greenhouse-warmed Earth of 2037 will contain more energy than today’s Earth. Its oceans will be warmer, its land will be warmer, and the underlying changes in temperature and precipitation will be driven by persistent greenhouse forcing rather than the temporary rearrangement of heat associated with ENSO.
So while the 2027 El Niño may well help us gain some insight into what a hotter planet looks like, we should avoid thinking this is the climate of the future.
We thank Kevin Trenberth for his comments on a draft of this post.
Code to reproduce the figures is here.
This is a back-of-the-napkin calculation. If you want a high-quality estimate, you need to do the regression at a range of lags and use that to do a full-year calculation.
It kinda feels like the conclusion is that 2037 will likely be worst than the brief El Niño heat of 2027. Everything will have more heat and more energy, etc.
the el nino phase of ENSO heats up the planet by redistributing warm western Pacific surface water over the cool equatorial waters of the southeast Pacific, so redistributes heat and water vapor transfer to the atmosphere but not changing heat content much. As this piece describes, this is much different from the global warming signal, more concentrated at the poles, where the surface heat budget is increasing. Many thanks to you for pointing out the difference.