
TCB quick hit: How climate change broke the Pacific Northwest’s plumbing
It’s not just wetter storms—it’s also the important shift from snow to rain

Flooding in the Pacific Northwest (PNW) has recently turned deadly serious, as days of intense rain from a powerful atmospheric river have swollen rivers and caused widespread flooding across the PNW.
If you guessed climate change was playing a role in this, you’d be right. Climate change isn’t just making storms “wetter” in a simple sense; it is fundamentally breaking the region’s natural plumbing system.
Here is why:
1. The atmosphere is wetter
The first mechanism is the one you hear about most often: basic thermodynamics. The rule of thumb (the Clausius-Clapeyron relation for the science geeks) is that for every degree Celsius the atmosphere warms, it can hold about 7% more water vapor.
If the atmosphere is a sponge, then a warmer atmosphere is a bigger sponge. This allows the atmospheric river that carries water from the Pacific to soak up more moisture from oceans that are also warmer than average. When that “sponge” hits the Cascades or Olympics and gets wrung out, there is simply more water available to fall than there was in the past.
Because of this, the IPCC says: “Human influence has contributed to the intensification of heavy precipitation in three continents where observational data are more abundant (high confidence) (North America, Europe and Asia).” [IPCC AR6 WG1, Section 11.4.4].
2. The Phase Shift: Rain vs. Snow
This is another critical factor for the PNW. In the cooler 20th-century, much of the precipitation hitting the Cascades or Olympics would fall as snow. Snow is safe. Snow sits there. It accumulates without drama, effectively “banking” water for the spring and summer months when it is needed most.
However, as freezing levels rise due to warming temperatures, precipitation is increasingly falling as rain. Unlike snow, rain does not sit quietly in the mountains and wait for spring. It runs off immediately.
So when a storm dumps 10 inches of precipitation and half of it falls as snow, the rivers only have to handle 5 inches of water immediately. But if all of it falls as rain because it’s 45°F in the mountains, the rivers have to handle the full 10 inches right now. This climate-enhanced runoff can overwhelm the river system, leading to the widespread flooding we see now.
Climate misinformers
I have no doubt that climate misinformers will be quick to argue whatever they can to downplay the clear physical connections between climate change and the disastrous flooding the PNW.
One technique they use is a laser focus on observational trends rather than the physics of the situation. They do this because observational trends are harder to interpret and more likely to be ambiguous than the physics.
The reason is that extreme events are, by definition, rare. Thus, even with a century of data, it can be hard to statistically identify a trend.
To demonstrate this, I performed a Monte Carlo simulation to evaluate the likelihood of statistically confirming a flood trend in a “flashy” Pacific Northwest river. For each of 1000 iterations, I generated a 100-year synthetic time series where the median flow linearly increased by 20%—representing a strong underlying climate signal. This was added to random year-to-year variability simulated by a log-normal distribution with a logarithmic standard deviation of 0.5.
I then ran a standard linear regression1 on each of the 1,000 synthetic datasets to test for a trend. The histogram displays the resulting distribution of P-values; crucially, it shows that a statistically significant trend is detected in about one sixth of these simulations, even though the trend was in all of them.
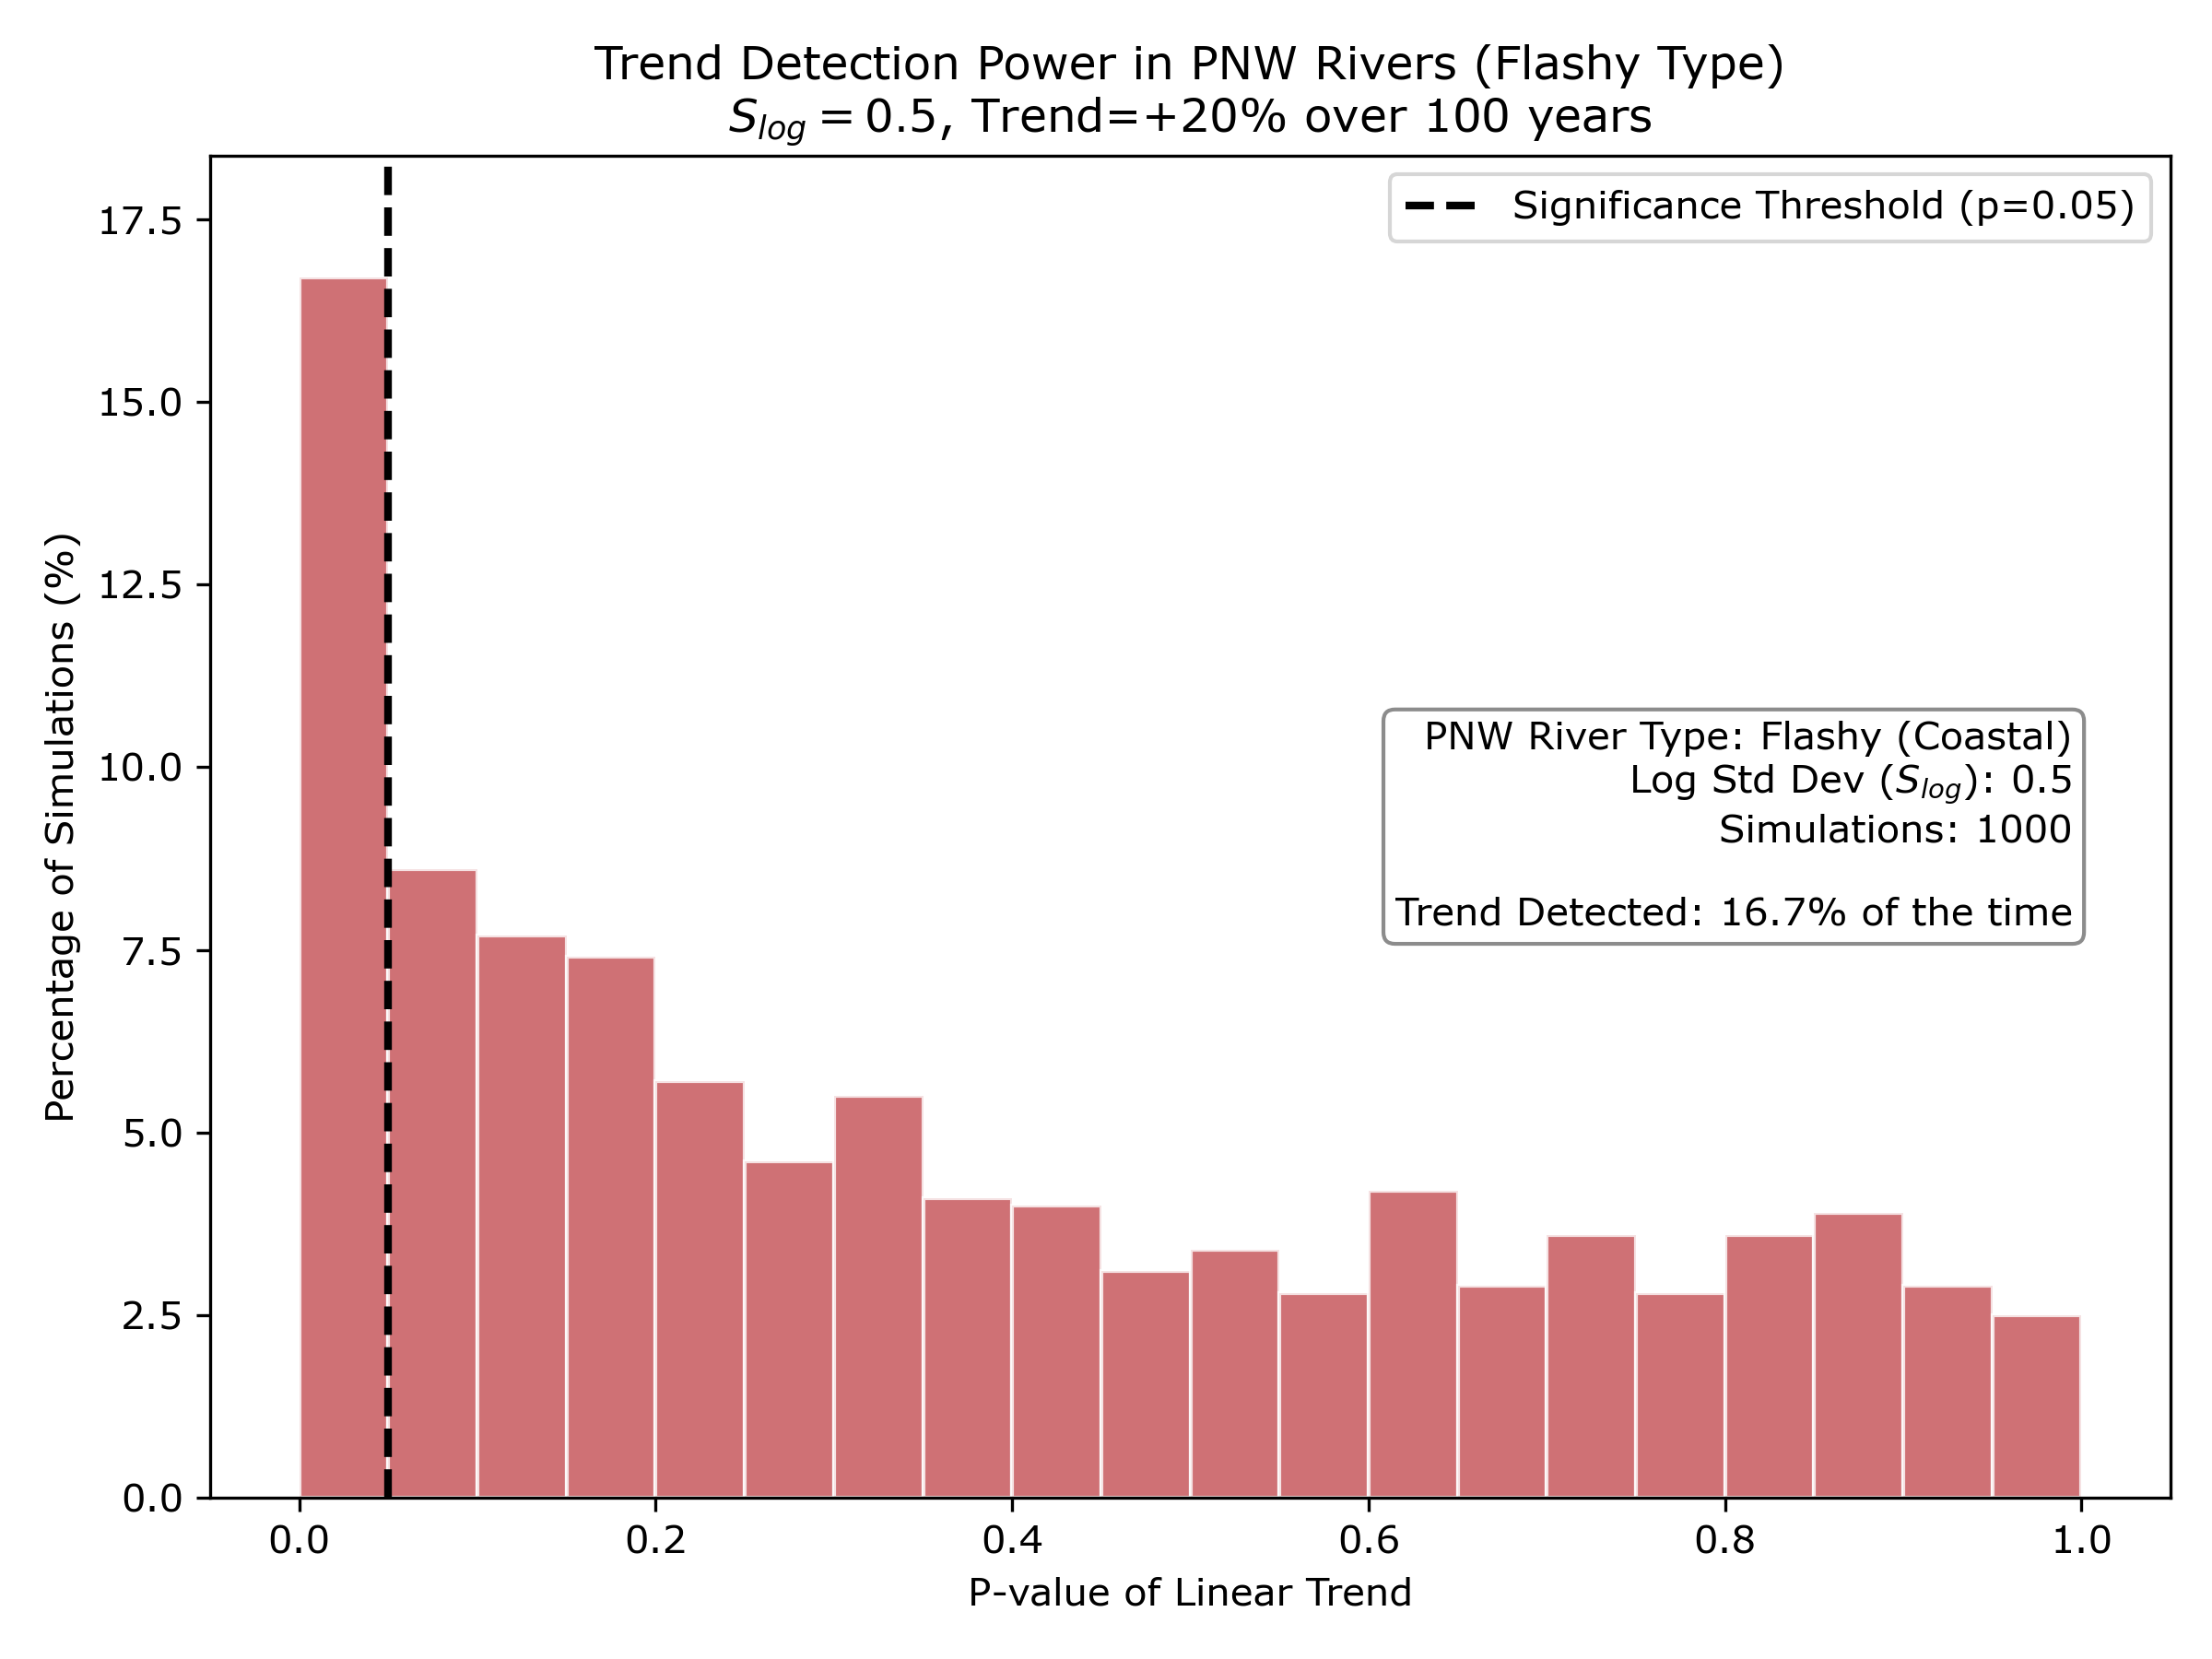
Another one sixth of the slopes are negative, which would give you the opposite of the acruel underlying climate trend.
This calculation demonstrates that, in high-variability rivers like those found in the PNW, a clear climate signal can be largely undetectable in the observed records. Thus, absence of a trend should not be taken as evidence that the trend does not exist.
But the physics tells us that a trend is almost certainly there. So please don’t trust anyone that only talks about the observed trends and then, mysteriously, fails to talk about the physics.
Note that this simple physical argument won’t tell you how much of the trend is due to climate change—that will require additional analysis. But for the question “Is climate change having an effect,” we can answer, “Almost certainly yes.”
I’d be grateful if you could hit the like button ❤️ below! It helps more people discover these ideas and lets me know what’s connecting with readers.
You get basically the same answer if you regress log(discharge) vs. time.
Thumbs-up
Precipitation falling as rain instead of snow has implications not only for flooding but for the water cycle. Ecosystems and agriculture will be affected in the region if there's less water in the summer due to less snowpack accumulating in the winter.