October on track to smash prior monthly records
Temperatures so far have remained gobsmacking, if not quite as bananas as September
Today I published the Q3 State of the Climate update over at Carbon Brief. I’d suggest folks give it a read, as it walks through all of the observed changes across the surface, oceans, and cryosphere. However, I wanted to highlight the part of the analysis that shows just how exceptional October temperatures have been to-date.
While global temperature records are not yet in for the full month of October 2023, real-time reanalysis products increasingly allow scientists to track global temperatures on a daily basis.
Reanalysis pulls together a huge amount of data from satellites, weather balloons, aeroplanes, weather stations, ships and buoys to provide a detailed look at how the Earth’s climate is changing in real-time.
Modern reanalysis products, such as JRA-55 and ERA5, use state-of-the-art methods to produce records that align well with traditional surface temperature datasets over recent decades.
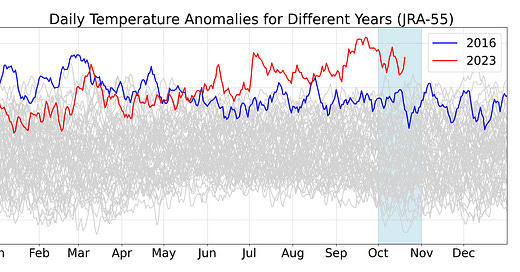
The figure below shows the daily global temperature anomaly values from the JRA-55 reanalysis product for each day since the record began in 1958 (grey lines). It shows the current year to date (2023) in red and the prior record warm year, 2016, in blue. Nearly every single day since mid-June 2023 has been warmer than any prior days since the JRA-55 record began in 1958 – and, potentially, much further into the past.

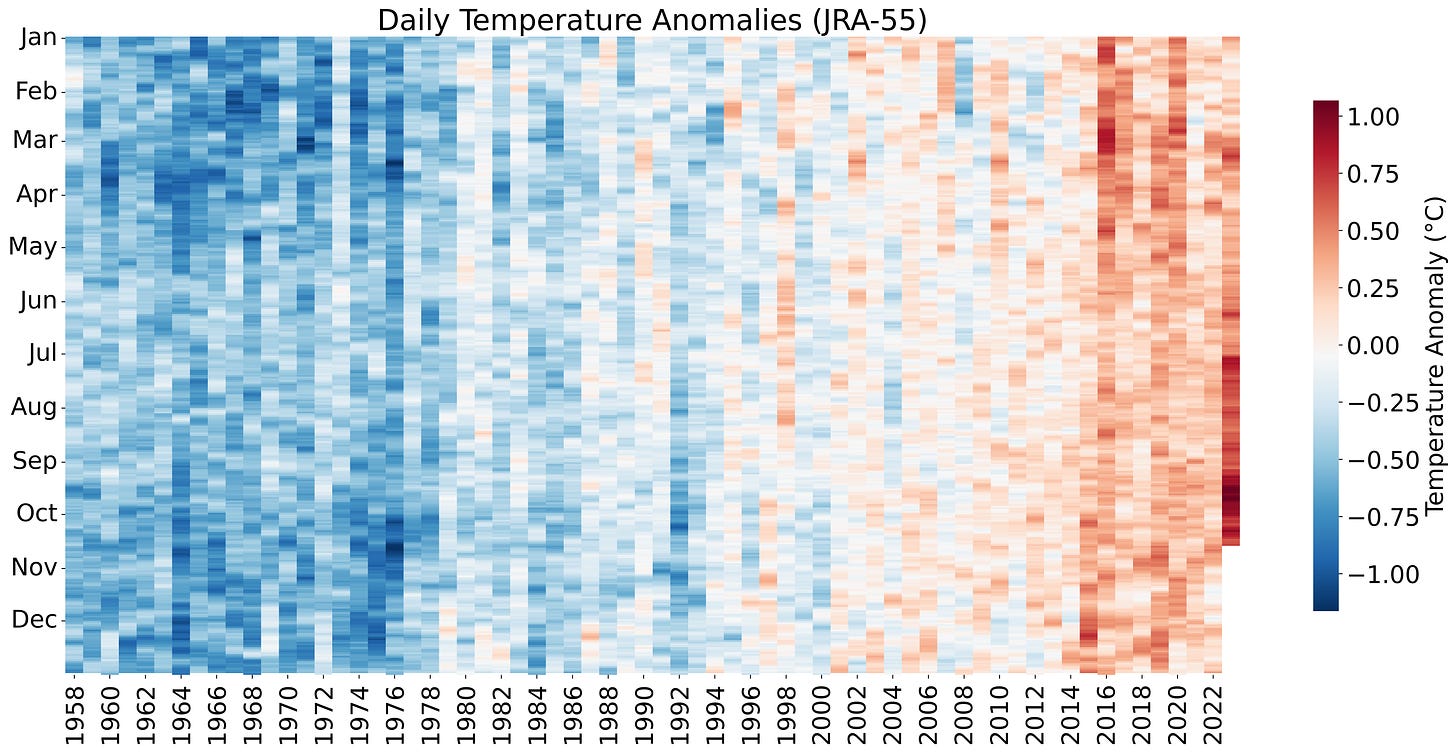
We can see just how anomalous the past few months have been in the heat map below, which shows daily temperature anomalies for every day since the record began in 1958:
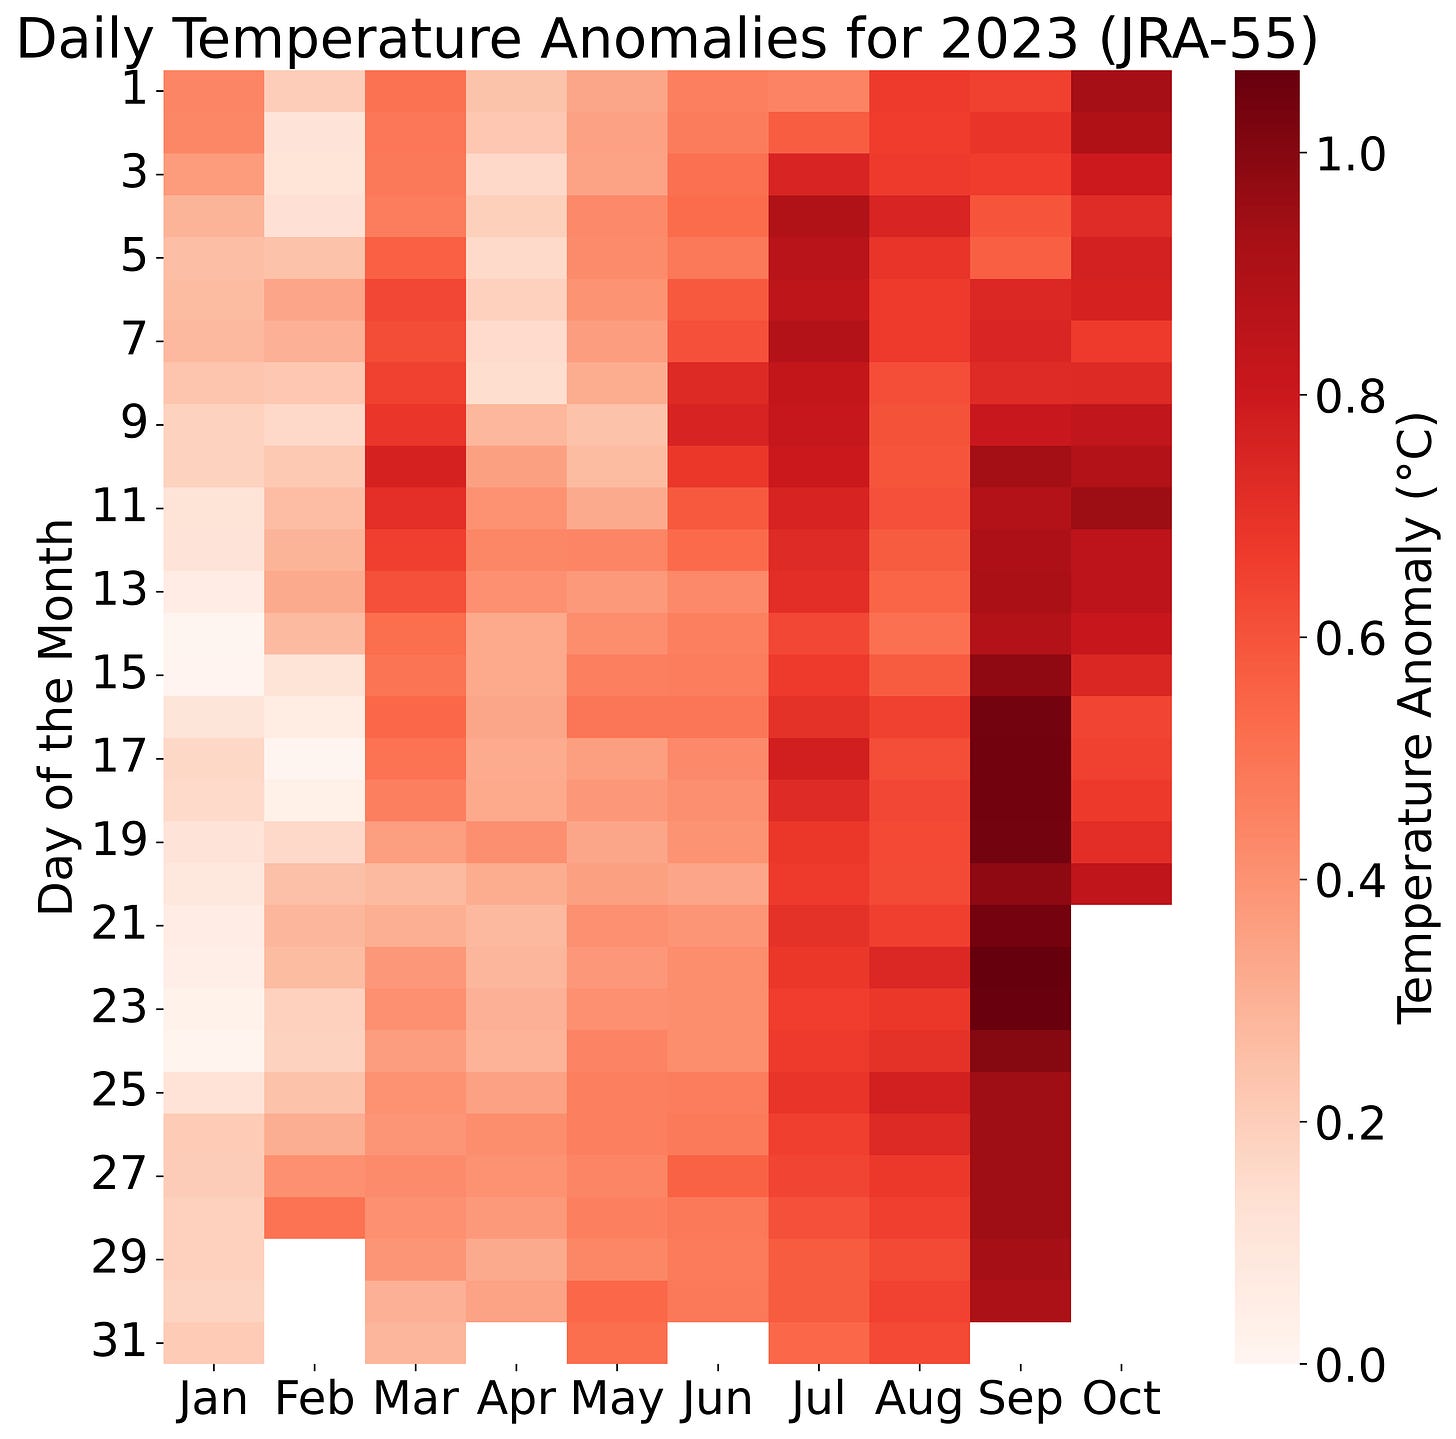
From here we can zoom in on the current year, which starts out warm by historical standards but becomes exceptionally hot from July onwards.
With most of the data for the month of October now available in the JRA-55 reanalysis product, I estimate that October 2023 will be the warmest October on record, and that it is likely to exceed the prior record by at least 0.3C. Here I’m basing the estimate and uncertainty intervals on the historical relationship between the first 19 days of the month (which is whats available so far) and the overall monthly average.
October is projected to not be quite as extreme as September’s record-shattering anomaly, but will still come in as the second highest anomaly of any month on record.
In addition to temperature anomalies, reanalysis products are able to provide an accurate near-real-time estimate of global absolute temperatures. The figure below shows the absolute temperature of each month of 2023 compared to all prior years in the record, with my October estimate and its uncertainties shown.
The exceptional temperatures we will see in October will even further increase the odds (already at virtually certain) that 2023 will be the warmest year since records began. For more details, see the Carbon Brief Q3 State of the Climate update.


I definitely recommend that everyone take a look at the Carbon Brief article. I definitely see similar sawtooth-like temperature excursions for the 1998 and 2016 El Nino events. Only time will tell what the 2023-2024 El Nino temperature excursion looks like. Let’s just hope that the Multimodel forecast holds up.
One almost has to take a step back and remain a somewhat objective observer about the whole situation. We may need to approach this as many people approach the stock market, i.e., we are in this for the long haul and not worry so much about the short-term fluctuations.
In the end, these short-term excursions are already in the “pipeline” and there is very little we can do except record the data and try to understand it. In my opinion, it is only helpful if these “unnerving, mind-boggling” excursions drive a deeper sense of urgency about taking action.
I for one wish the National Academies report released last week, https://www.nationalacademies.org/news/2023/10/new-report-provides-comprehensive-plan-to-meet-u-s-net-zero-goals-and-ensure-fair-and-equitable-energy-transition, that provides a plan for meeting U.S. net-zero goals by 2050, was getting more press and attention from the media and the climate science community. I believe that is where we really need to be focusing our attention. We need to call on policymakers in Washington to adopt the recommendations laid out in that plan.
Loeb et al (2121):
ASR, .65 W/m2/decade 2002-2022
CO2 and all other trace GHGs, .22 W/m2/decade
Factually incorrect?