

Whether global warming has accelerated (and how much it has accelerated) is one of the livelier debates in climate science at the moment. The physical case for it is fairly strong: cooling aerosol pollution has fallen substantially over the past two decades while greenhouse gas emissions remain near record highs. The observed rate of warming over the past decade is roughly double what it was over the prior four decades. But showing that this speed-up is statistically distinguishable from the normal year-to-year wiggles of the climate has proven surprisingly hard.
A new paper by Jin and Pu in the journal npj Climate and Atmospheric Science argues that the data through 2025 now show a statistically significant doubling of the warming rate. I broadly agree with them that warming has sped up. But the method they use is problematic, and would find a significant acceleration in many simulated worlds where none exists.
To start with, let’s look at the data. The figure below fits a single continuous trend line to annual global temperatures since 1970, allowing the slope to change at whichever year fits the data best (2012, in this case). The rate of warming between 1970 and 2012 was 0.18C per decade (with an uncertainty range of 0.15C to 0.20C), while warming between 2012 and 2025 was 0.35C per decade (0.26C to 0.45C).1
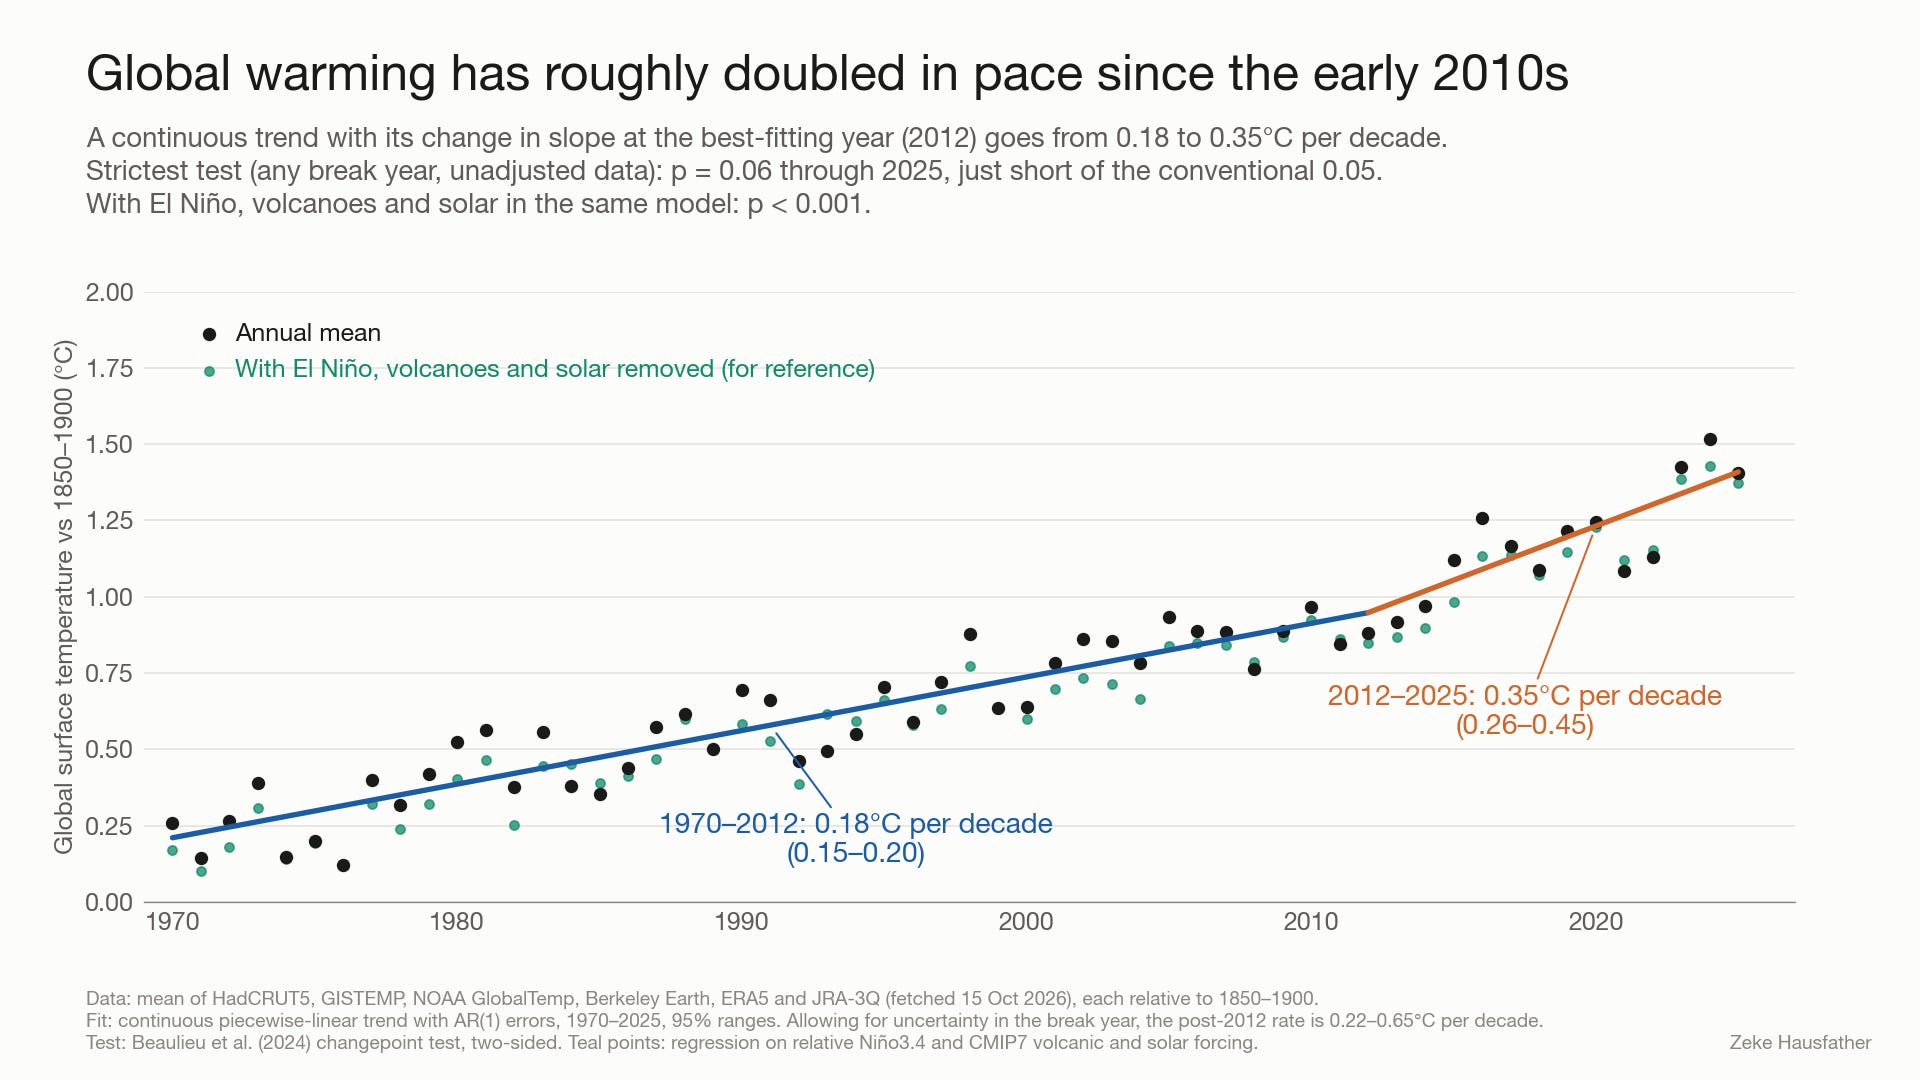
Whether that change is “statistically significant” depends on how you test it. Beaulieu et al. (2024) used a demanding test that allows the change to happen in any year, and found that a surge in warming was “not detectable yet” with data through 2023. Foster and Rahmstorf (2026) applied the same test to data through 2024 and also found no significant acceleration in the raw data, but argued that acceleration was detectable (with 98% confidence) after removing the estimated effects of El Niño, volcanic eruptions and solar variability. Running their test on the raw data through 2025, I get a p-value of 0.06 for the average of six global temperature datasets (just shy of the conventional 0.05 threshold). Across the individual datasets I’ve used in this analysis it ranges from 0.02 (NOAA) to 0.13 (JRA-3Q), with only NOAA and NASA’s GISTEMP below 0.05. If El Niño, volcanoes and solar are included in the same statistical model, it drops below 0.001.
What Jin and Pu did
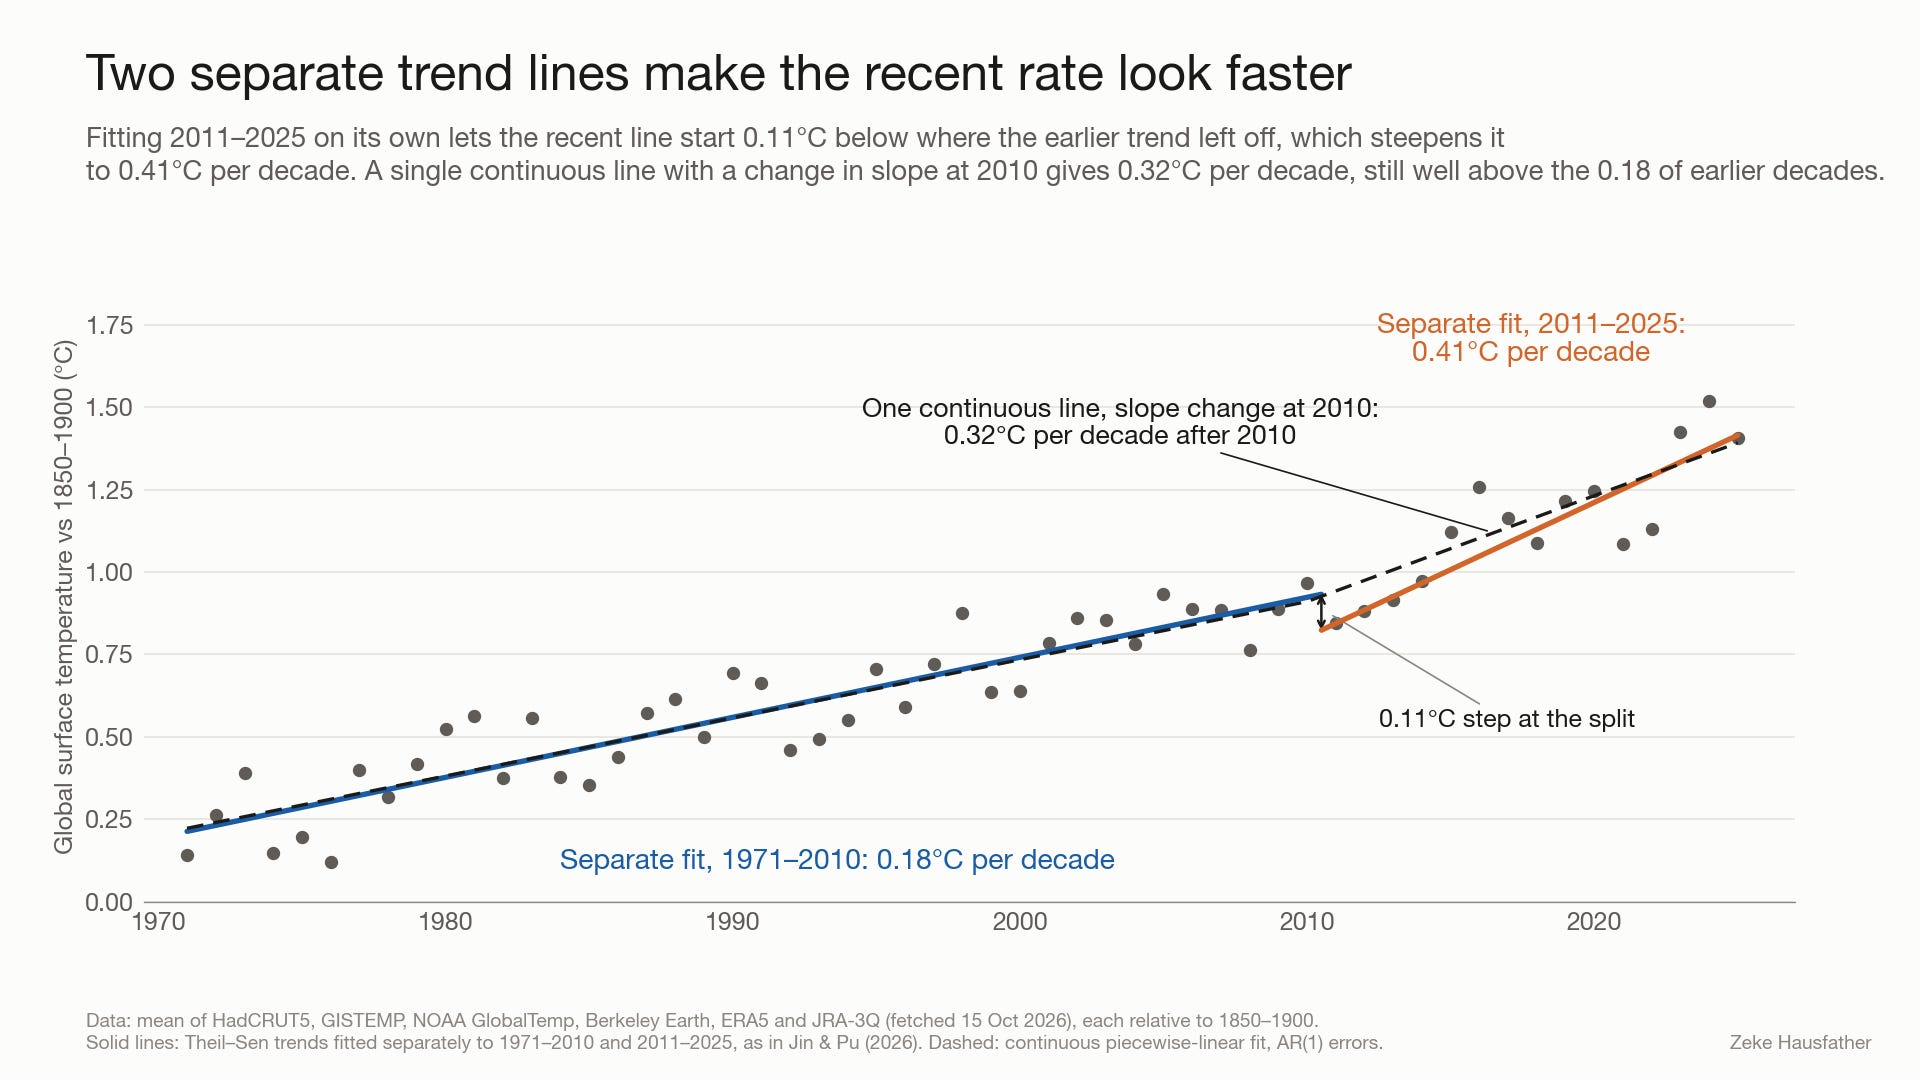
Jin and Pu report warming of 0.40C per decade over 2011-2025 compared to 0.20C per decade over 1971-2025, and find the difference statistically significant in all five datasets they examine.2 If you fit a separate trend line to 2011-2025 you do get a number close to theirs (0.41C per decade on the six-dataset average I use here).
The problem lies in how the comparison is constructed. Back in 2017, Rahmstorf, Foster and Cahill described “two important but underappreciated pitfalls waiting to trap those testing for a change in the trend of global temperature time series.” These are “the multiple testing problem, and failure to account for the additional degree of freedom when one uses a model with a jump discontinuity (a broken trend).” At the time that paper was published, these pitfalls were producing claims of a significant slowdown in warming (during the so-called “hiatus” period from 1998-2012). A decade later Jin and Pu’s approach runs into both of these problems, albeit in search of an acceleration rather than a slowdown.
The first is the broken trend. Jin and Pu fit two independent lines, one to 1971-2010 and another to 2011-2025, with nothing forcing the second line to start where the first left off. In the figure below the recent line starts 0.11C below where the earlier trend ended, which steepens it. A single continuous line with a change in slope at 2010 gives 0.32C per decade since then, still well above the 0.18C per decade of earlier decades but not as high as their approach would imply.
The second is how the split year was chosen. Jin and Pu tried every dividing year from 1980 to 2015 and found that “the largest and most statistically significant contrast in warming rates occurs when the dividing year is near 2010–2011. Accordingly, 2011 is adopted as the start of the recent warming period.” As far as the paper describes, the significance test at 2011 makes no adjustment for having searched across all those split years. Beaulieu and colleagues warned about exactly this: if the year of the change is “selected visually among the many possibilities where it can occur without accounting for this, statistical mistakes can ensue.”
Testing the approach on synthetic data
One way to see how much this matters is to apply the same procedure to simulated temperature records where we know there is no acceleration. To do this, I generated 5,000 synthetic records that each warm at a steady 0.20C per decade from 1971 to 2025. Each has year-to-year noise with the same size and persistence as the real temperature record. For each one I tried every split year from 1980 to 2015, kept the one with the biggest contrast between the before and after trends, and tested whether the recent trend was significantly faster using the standard 95% threshold.3
The figure below walks through the process. The first three panels show one of these synthetic worlds that the procedure flagged. Its true trend is a constant 0.20C per decade, but splitting at 2012 gives 0.19C per decade before and 0.36C after, a “doubling” that looks almost exactly like the real record. Across all 5,000 worlds, 22% to 34% are flagged as having a significant acceleration, depending on exactly how the two trends are compared. A test for significance at the 95% level should do this at most 5% of the time.
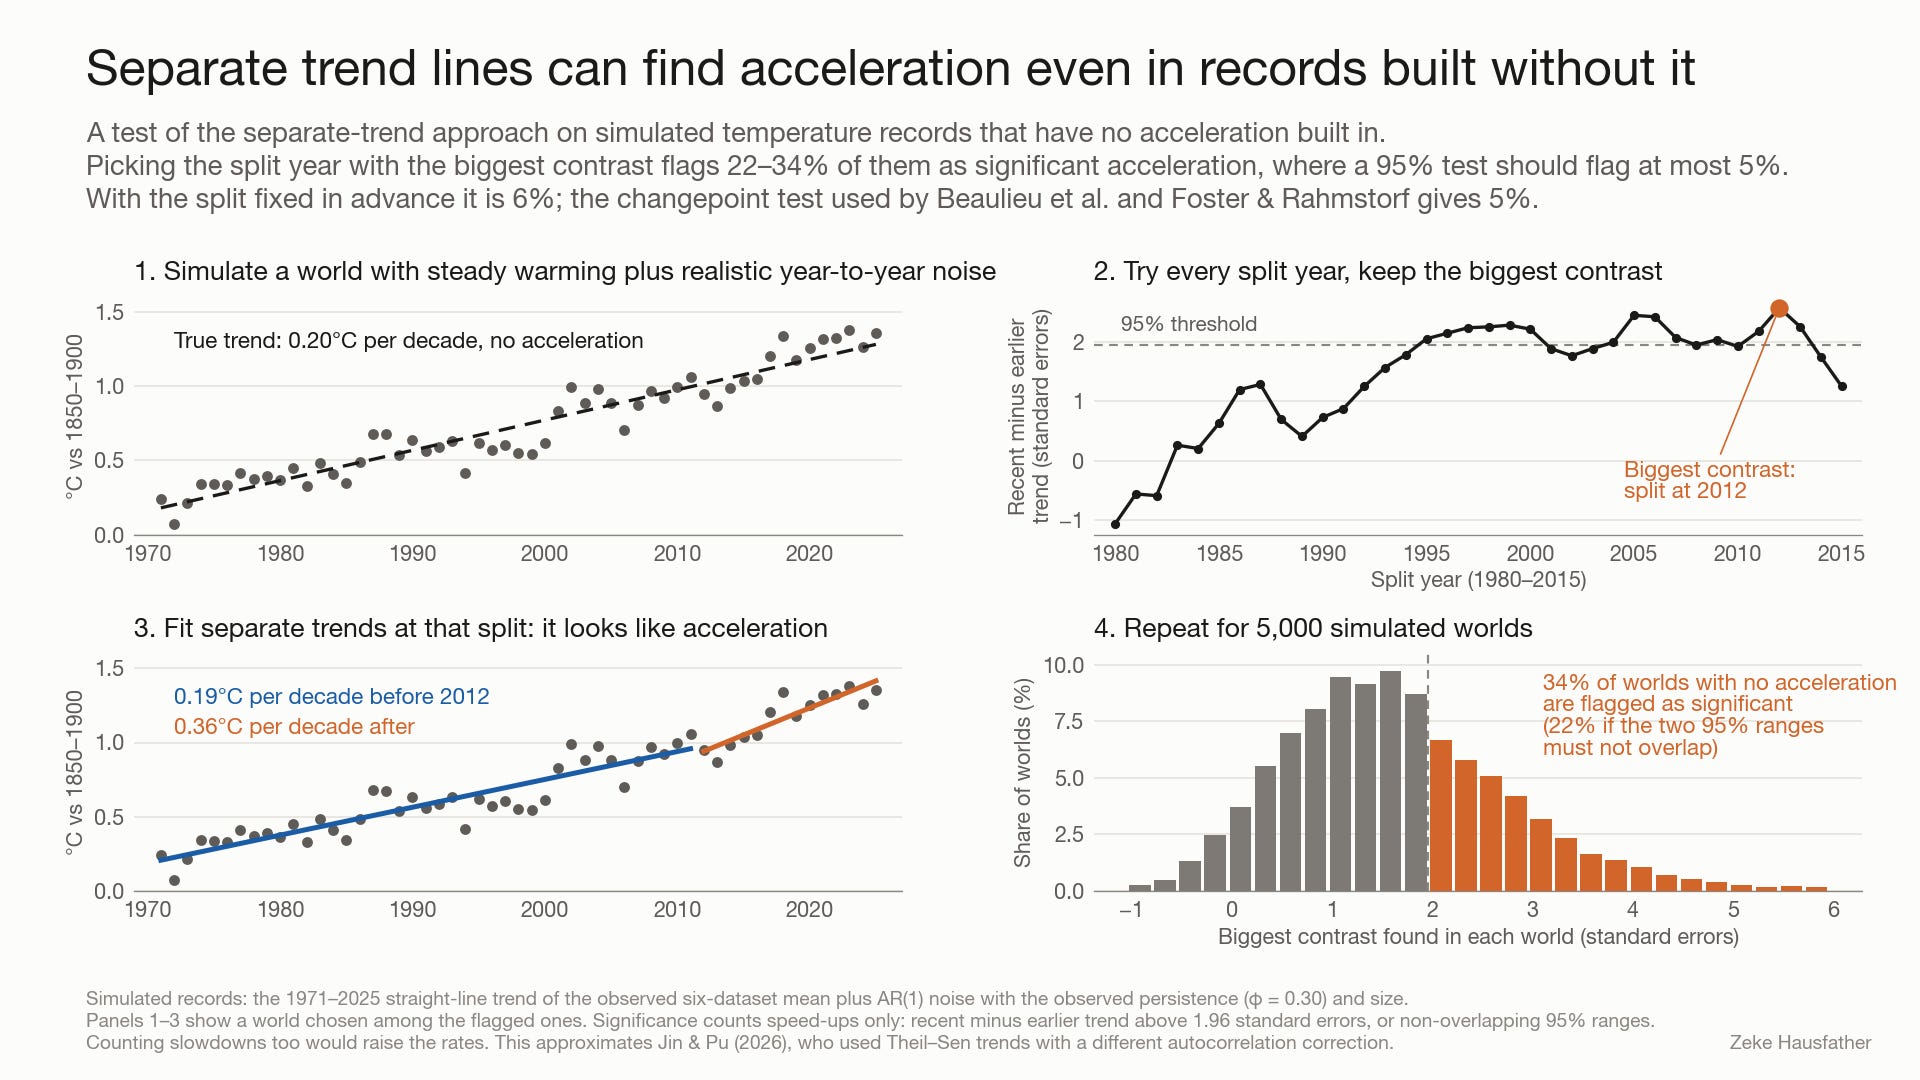
By contrast, the changepoint test used by Beaulieu et al. and by Foster and Rahmstorf, which builds the search over break years into its significance threshold, only shows a false positive rate of 5%. That extra rigor is why it is so much harder for that test to reach significance, and why its result through 2025 is just shy of the threshold despite a near doubling of the warming rate.
So what are the takeaways here?
A decade ago the same two shortcuts (broken trend lines and a split year chosen after looking at the data) made a temporary slowdown in warming look like a significant “pause.” The statistical tools developed in response to that debate (many of them by the same researchers now finding acceleration) are a big part of why a later review of the pause literature found “little or no statistical evidence” for a slowdown, while describing broken trends as a “common (but questionable) practice.” Applying them consistently means accepting that they will be slow to confirm an acceleration too.
But as I’ve noted, there is a consilience of evidence that leads us to conclude that this time acceleration is likely real, even if it remains just short of statistically significant in surface temperature records. Today the physics and the data point in the same direction, and the raw record is now sitting right at the edge of formal detection with the strictest available test.4 With 2026 on track to be among the warmest years on record, that may not remain the case for long. I’ll return to this question early next year once the full 2026 data are in.
These rates are for a continuous trend line fitted with an allowance for year-to-year persistence in the noise. Allowing for uncertainty in which year the change occurred widens the post-2012 range to 0.22C to 0.65C per decade. For comparison, our recent Indicators of Global Climate Change 2025 report puts the rate of human-induced warming at 0.27C per decade (0.2C to 0.4C) over 2016-2025.
The datasets they examine differ from ours in that they exclude reanalysis (JRA-3Q and ERA5) and include the Chinese CMST3 dataset. Running the Beaulieu et al. / Foster and Rahmstorf continuous trend approach on the average of the five datasets does barely find significant acceleration (p= 0.047), as the reanalysis datasets tend to have a bit more year-to-year variability and thus a higher threshold for detecting acceleration.
Jin and Pu used Theil-Sen trends with a rank-based correction for autocorrelation and describe the two trends as “statistically distinguishable at the 95% confidence level.” My version uses ordinary least squares trends with a similar correction. Requiring the 95% ranges of the two trends not to overlap leads to a false positive rate of 22%. Testing the difference between the trends against 1.96 standard errors results in a rate of 34%. Both count only falsely-detected acceleration, so counting slowdowns as well would raise both numbers.
Its worth remembering that there is nothing particularly significant about significance levels. A false-positive rate of <5% (1-in-20) is a useful test to avoid being mislead, but we should also not dismiss out of hand results that fall close to that level. The ~94% chance of acceleration that we see in surface records today remains a strong signal, and another year of data should make it even stronger.
The main point that still remains is global warming is critically and unacceptably bad, no matter who disputes who.
As Earth burns... 🔥
Great stuff Zeke - I learned something. And I was surprised to see a paper with a not-even-consistent-across-the-breakpoint fit make it through peer-review. At least we should fit models that could happen in real life. Their model is literally impossible. And Kevin is quite right - the end points get a lot of weight in the fit for the slope of a line; the point in the middle literally gets 0 weight (when there is an odd number of points). It's reassuring to see that when you did the analysis correctly, the outliers occurred 5% of the time exactly as they should have.