

Twenty years ago, wind, solar and other non-hydro renewables were close to a rounding error. In 2005 they supplied a mere 2.0% of the world’s electricity generation. By 2015 that had risen to 6.8%, and by 2025 it was up to 19.8%. According to the IEA Electricity 2026 outlook, non-hydro renewables will supply around 21.8% of global electricity in 2026, edging past natural gas (21.6%) to become the second-largest source of power after coal.1
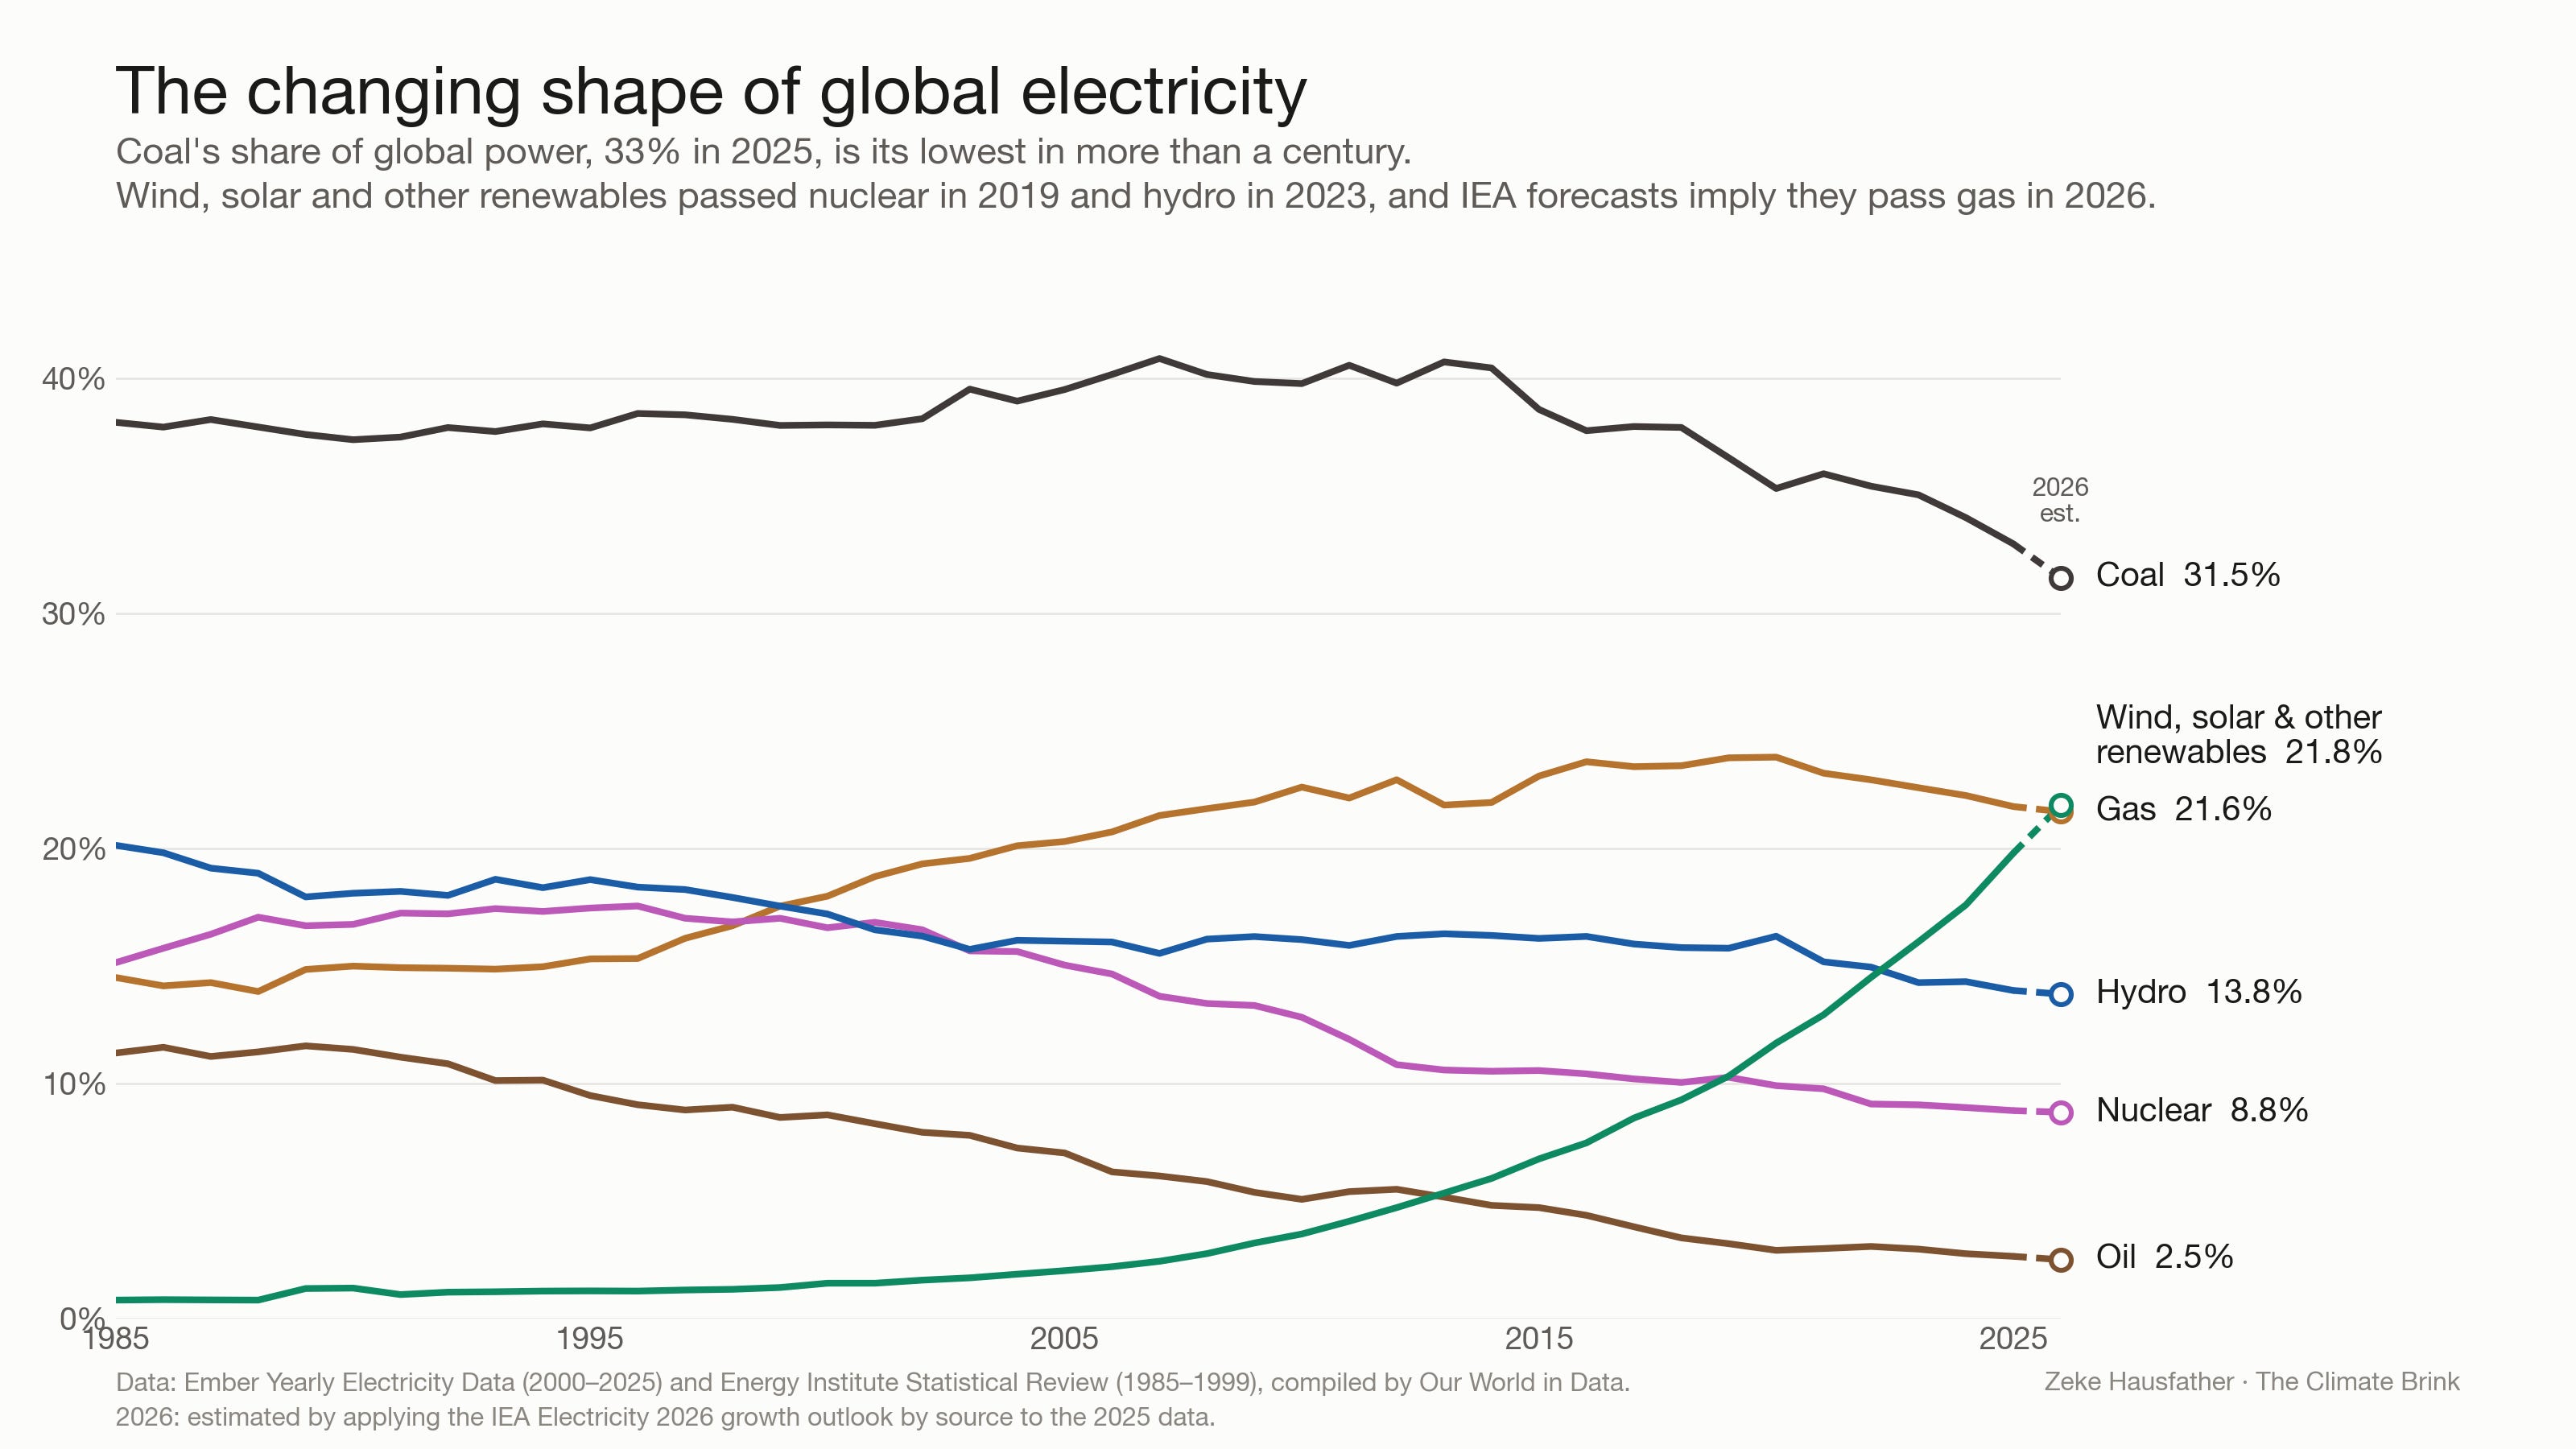
That is a remarkable pace of growth from an industry that barely existed two decades ago. But not everyone is impressed; many commenters on social media have responded to these figures by pointing out that despite the growth of renewables, fossil fuel generation continues to grow as well. They aren’t wrong; global coal generation set a record in 2024. Gas generation reached a new high in 2025.
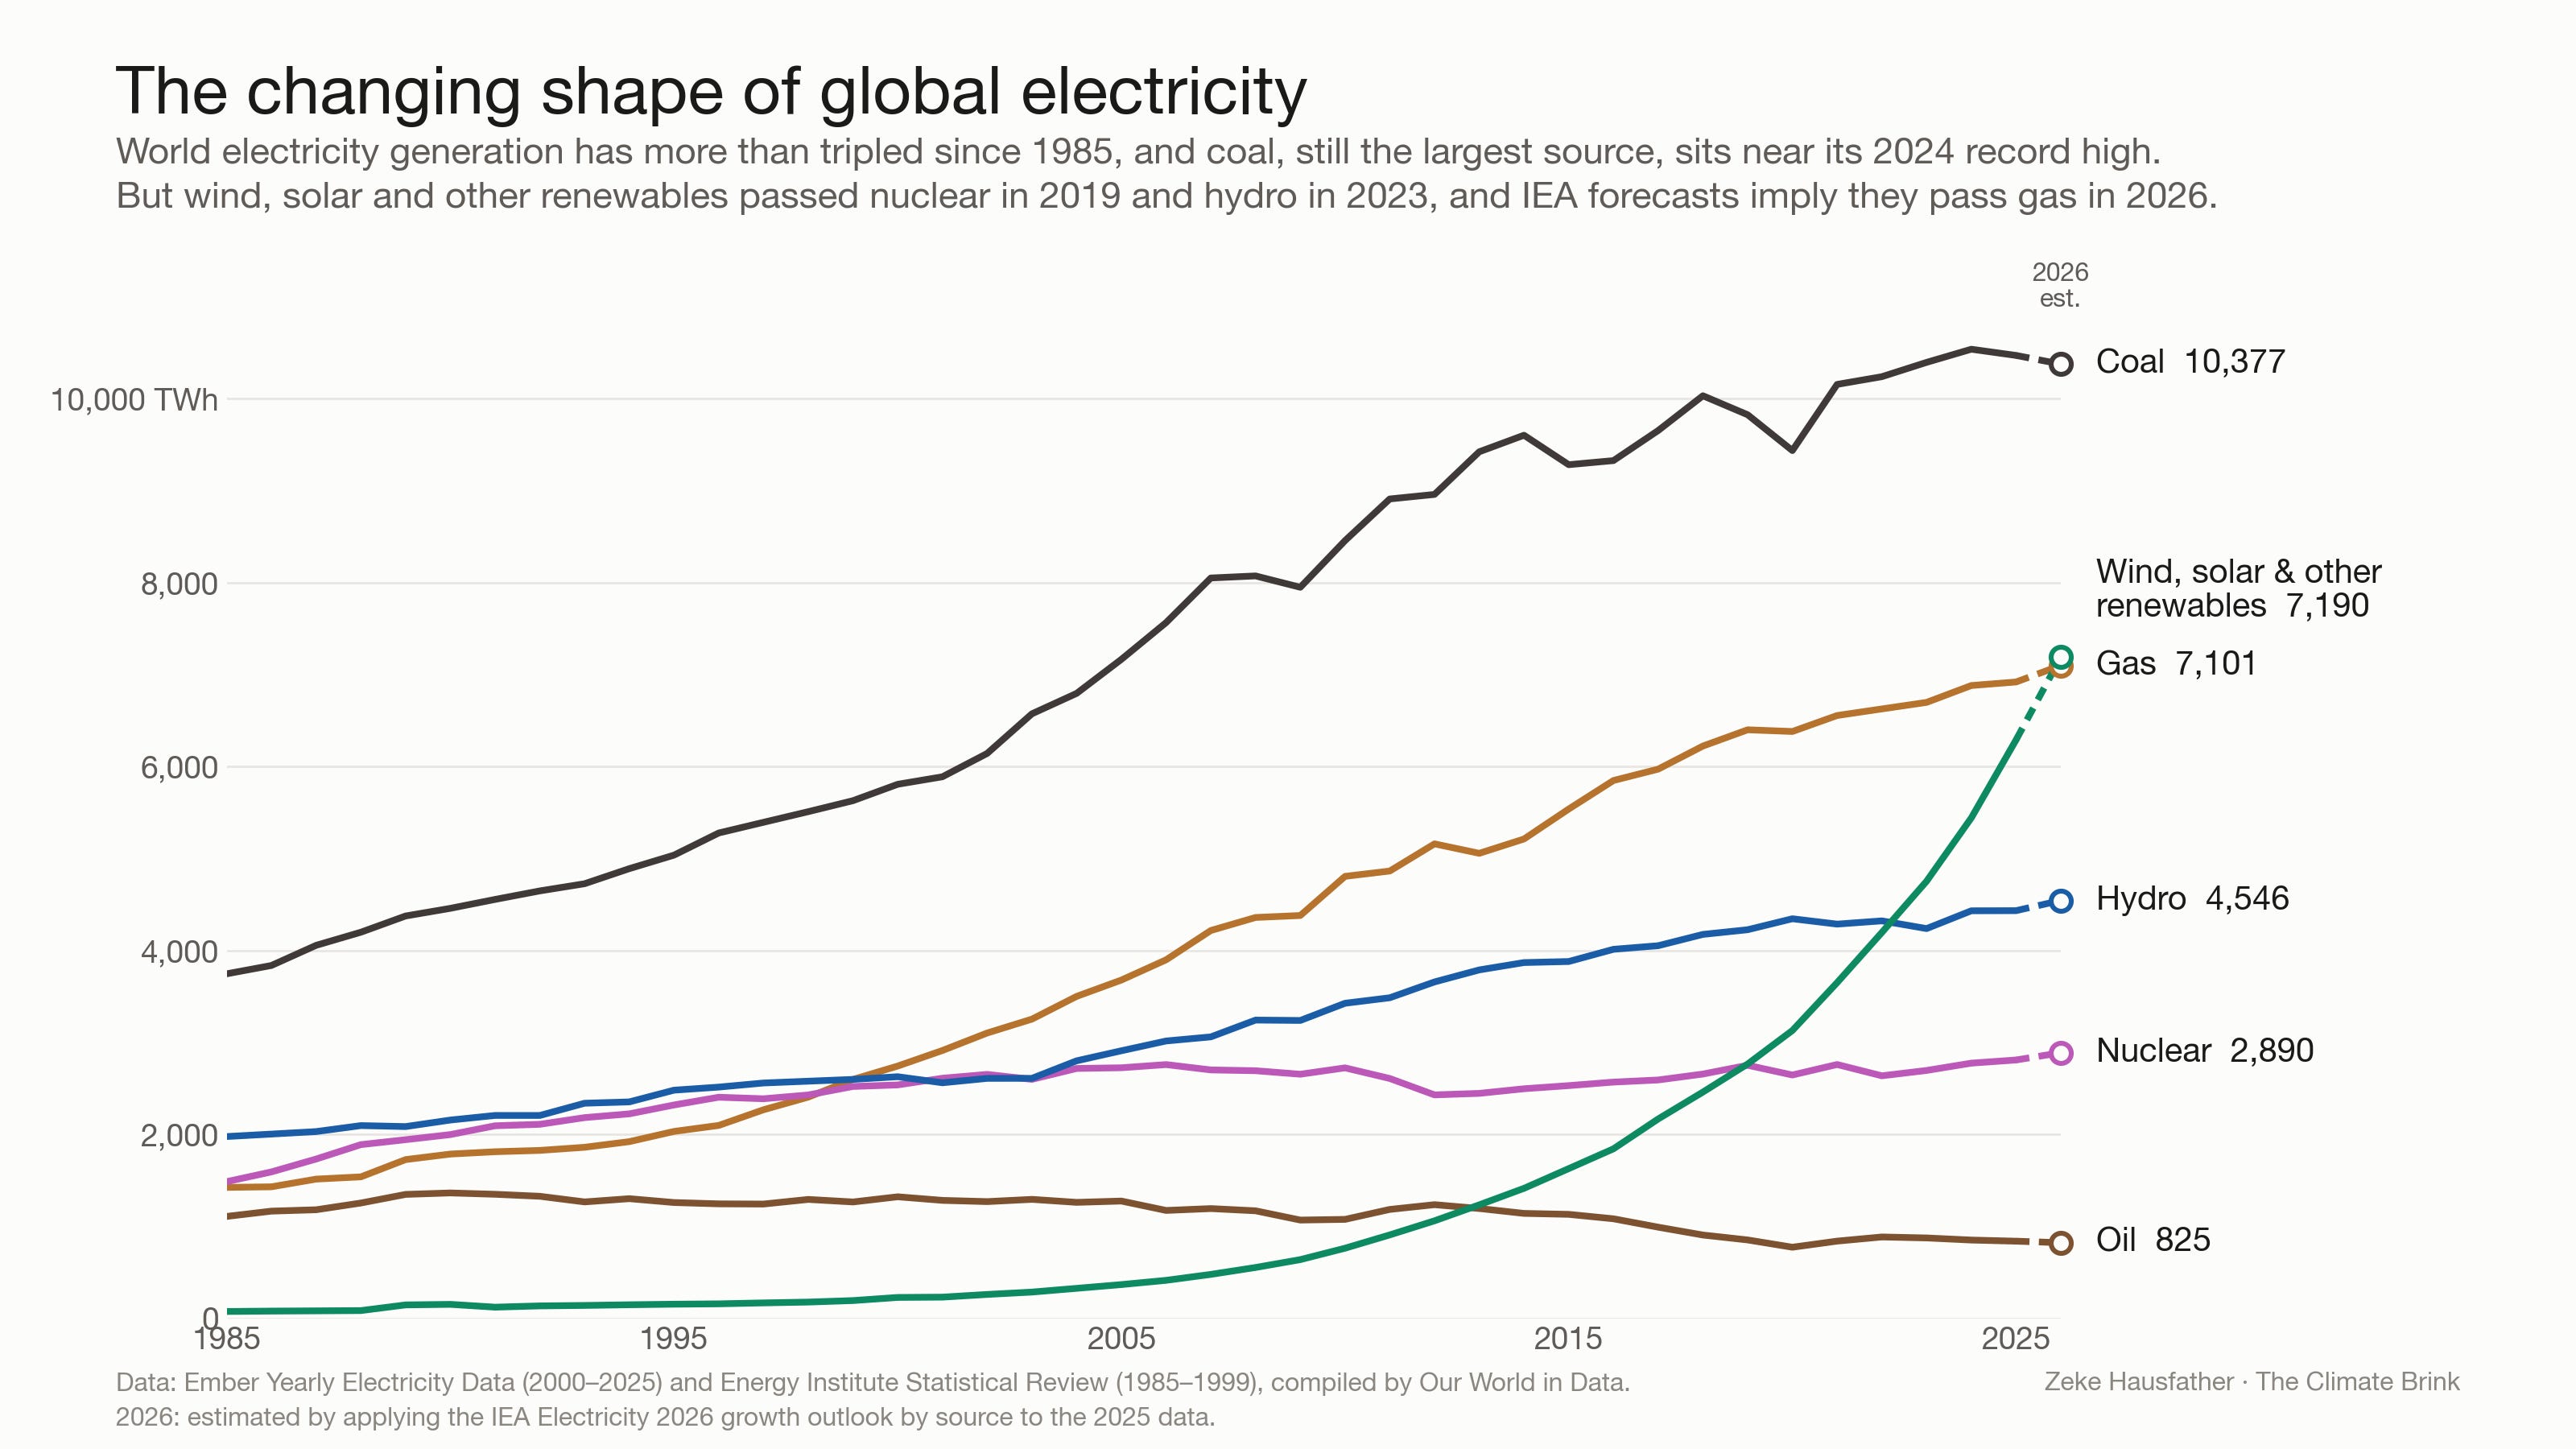
Their point is that clean energy isn’t replacing fossil fuels at all. It’s simply being piled on top of them to feed an ever-growing appetite for electricity, making this an “energy addition” rather than an energy transition. Global fossil electricity generation around 50% higher today than it was in 2005. Coal generation rose by 3,300 TWh and gas by 3,200 TWh. The world burns more coal for power now than it did when wind and solar started taking off.
This argument has been made in the past both by skeptics of growth and by energy systems modelers. The historian Jean-Baptiste Fressoz argues in More and More and More (2024) that “far from the industrial era passing through a series of transformations, each new phase has in practice remained almost wholly entangled with the previous one.” Coal mining created a huge new demand for timber for pit props, while the oil age ran on steel made with coal. Vaclav Smil has made the same point about today’s clean energy boom more bluntly: ”We use more fossil fuels today than at any time in history… Renewables are not replacing fossil fuels; are joining them.”
The question of counterfactuals
The problem with the “addition” argument is that it compares the world today with the world in 2005, rather than with the world as it would have been without clean energy. Electricity demand has not grown because wind turbines and solar panels were built. It has grown because of what the IEA describes as “rising consumption from industry, electric vehicles, air conditioning and data centers”. Demand growth is located overwhelmingly in emerging and developing economies, which accounted for about 80% of global demand growth in 2025 and an average of 95% over the past decade.
Global electricity demand rose by 75% (13,600 TWh) between 2005 and 2025. That demand had to be met by something. Wind and solar supplied 5,400 TWh of new demand, hydro 1,500 TWh, bioenergy and other renewables 530 TWh, nuclear 85 TWh, and fossil fuels the remaining 6,100 TWh. But over the past decade the balance has shifted sharply toward clean energy. Since 2015, wind and solar supplied 57% of demand growth, compared with 29% for fossil fuels. And in 2025, according to Ember’s Global Electricity Review 2026, “wind and solar grew by 841 TWh, meeting 99% of global electricity demand growth”.
A 2024 study by Brantley Liddle found that “intermittent renewables (solar and wind) have unitary displacement effect.” In other words, each unit of wind and solar power displaced about one unit of coal and oil generation. Fossil generation has kept rising in many years because demand has grown faster than clean energy could be added. That is very different from clean energy failing to displace anything.
And electricity demand will continue to rapidly grow, particularly if we succeed in reducing global emissions by electrifying sectors of the economy that currently burn fossil fuels. Most scenarios where we reach net zero emissions involve a doubling or tripling of electricity generation.
So if we want to assess the real world emissions impact of wind and solar buildout over the past 20 years, the right question to ask is not “did fossil use go down?” but rather “how much higher would it have been?”
A world without wind and solar
To answer this, I built a counterfactual for the global power sector in which wind and solar (and geothermal, which is less than 2% of the total) stopped growing in 2005. In every separate country, their generation is held at 2005 levels, while electricity demand, nuclear, hydro and bioenergy follow their real-world paths.2 The missing clean generation has to come from somewhere, and in this counterfactual it comes from fossil fuels.
The key choice is which fossil fuels are used to fill in the gap. A wind farm in China or India displaces coal, while one in Texas or the UK mostly displaces gas. So rather than assuming a single global fossil mix, the analysis fills each country’s gap with that country’s own coal, gas and oil mix in each year, using data for about 200 countries from Ember. This keeps real-world coal-to-gas switching like what occurred during the US shale gas boom in place, rather than crediting it to renewables.3
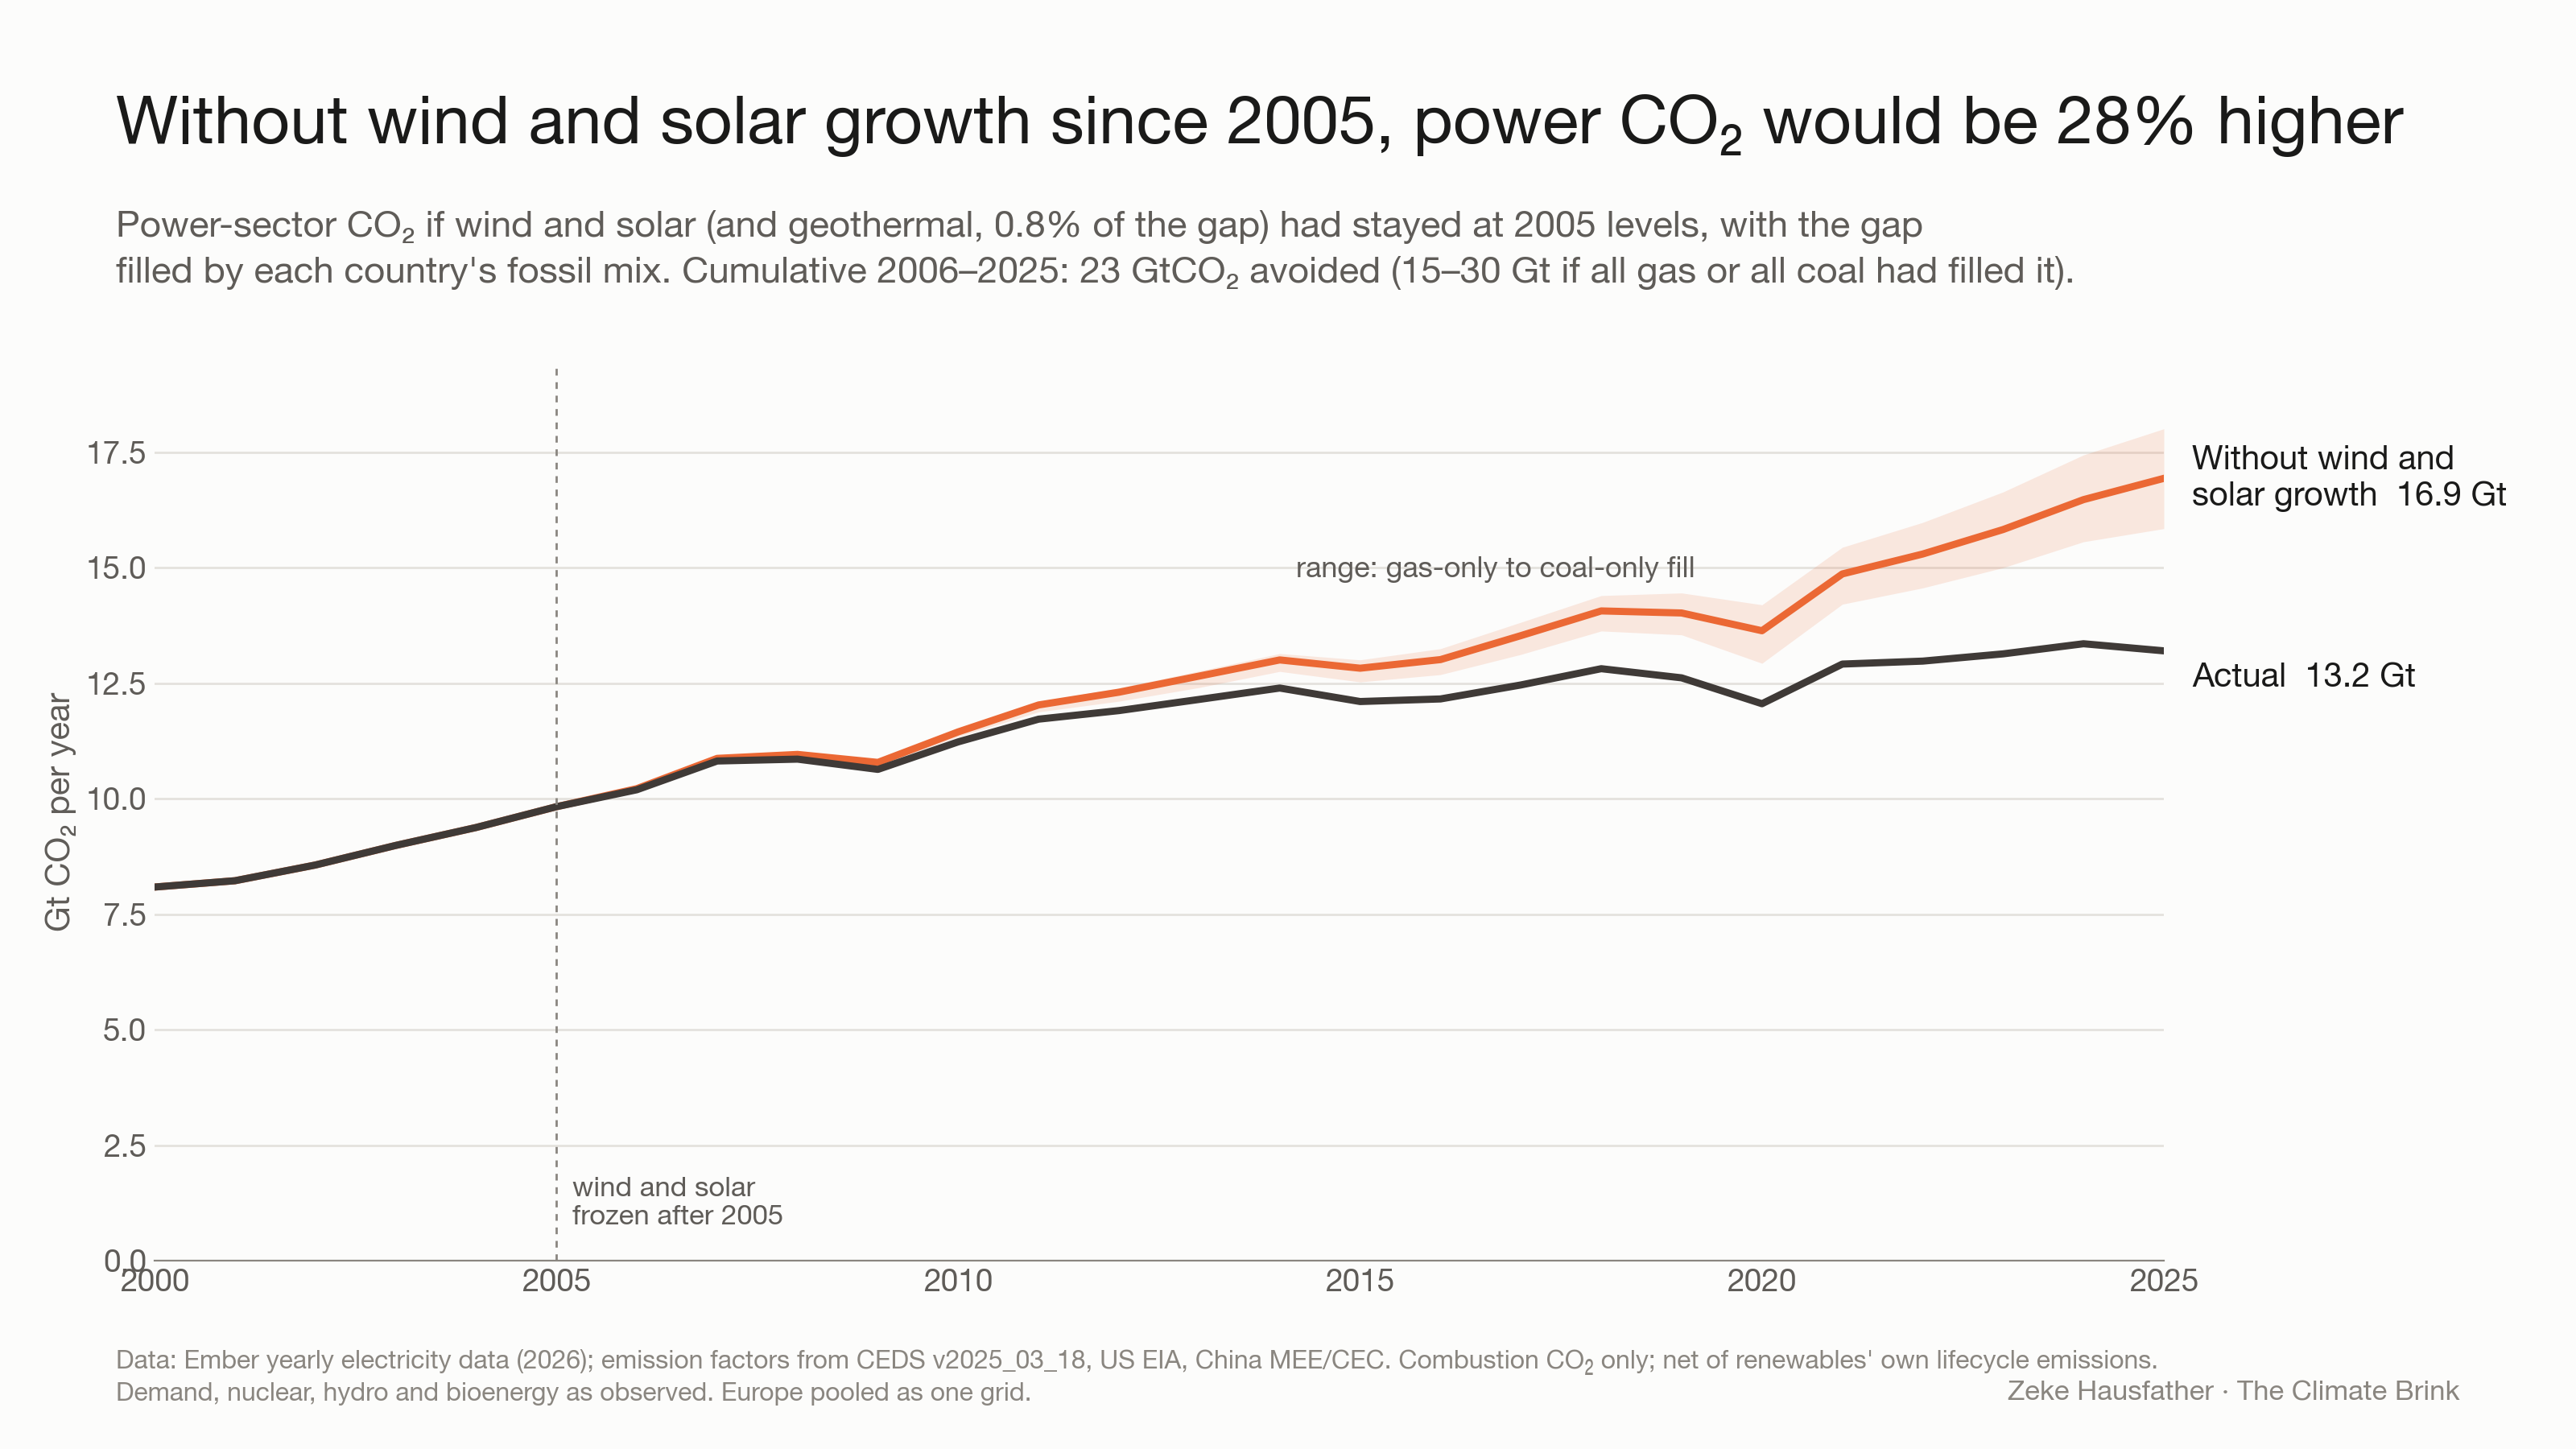
Without wind and solar growth since 2005, global power-sector CO2 emissions in 2025 would have been 28% higher, at 16.9 billion tonnes rather than 13.2 billion. This adds up to 3.7 billion tonnes avoided in 2025, which is about three-quarters of the total CO2 US emissions that year (or roughly 1.5x EU emissions).
Between 2006 and 2025, wind and solar avoided about 23 billion tonnes of CO2. The biggest assumption I’ve made is what fossil fuel fills in the gap: if every missing kilowatt-hour had come from gas, avoided emissions would be 15 billion tonnes, while if it was all coal it would have been 30 billion.
This lines up almost exactly with Ember’s own estimate. Using a simpler method (and a 2000 baseline rather than 2005 baseline), Ember’s Global Electricity Review 2026 found that “had wind and solar not grown since 2000, fossil generation would have been 30% higher in 2025, and emissions 28% higher.”
While its true that global electricity emissions have yet to clearly peak, it may well be imminent; emissions went down in 2025 and may be on track to decline in 2026 as well, though rapid increases in demand from vehicle electrification and data centers have made this a bit more challenging.4 But there are many countries in which electricity emissions have already peaked and declined substantially, and where clean energy has played a key role in those declines.
Already replacing fossil fuels in some countries
Globally, clean energy has not yet led to fossil fuel use peaking in the electricity sector. In 2025, fossil generation was essentially flat (down ~0.3%). But that global total hides a lot of country-level variability. In many wealthier economies, where demand has grown more slowly, clean energy has driven real emissions reductions (even when accounting for the outsourcing of some industrial production).
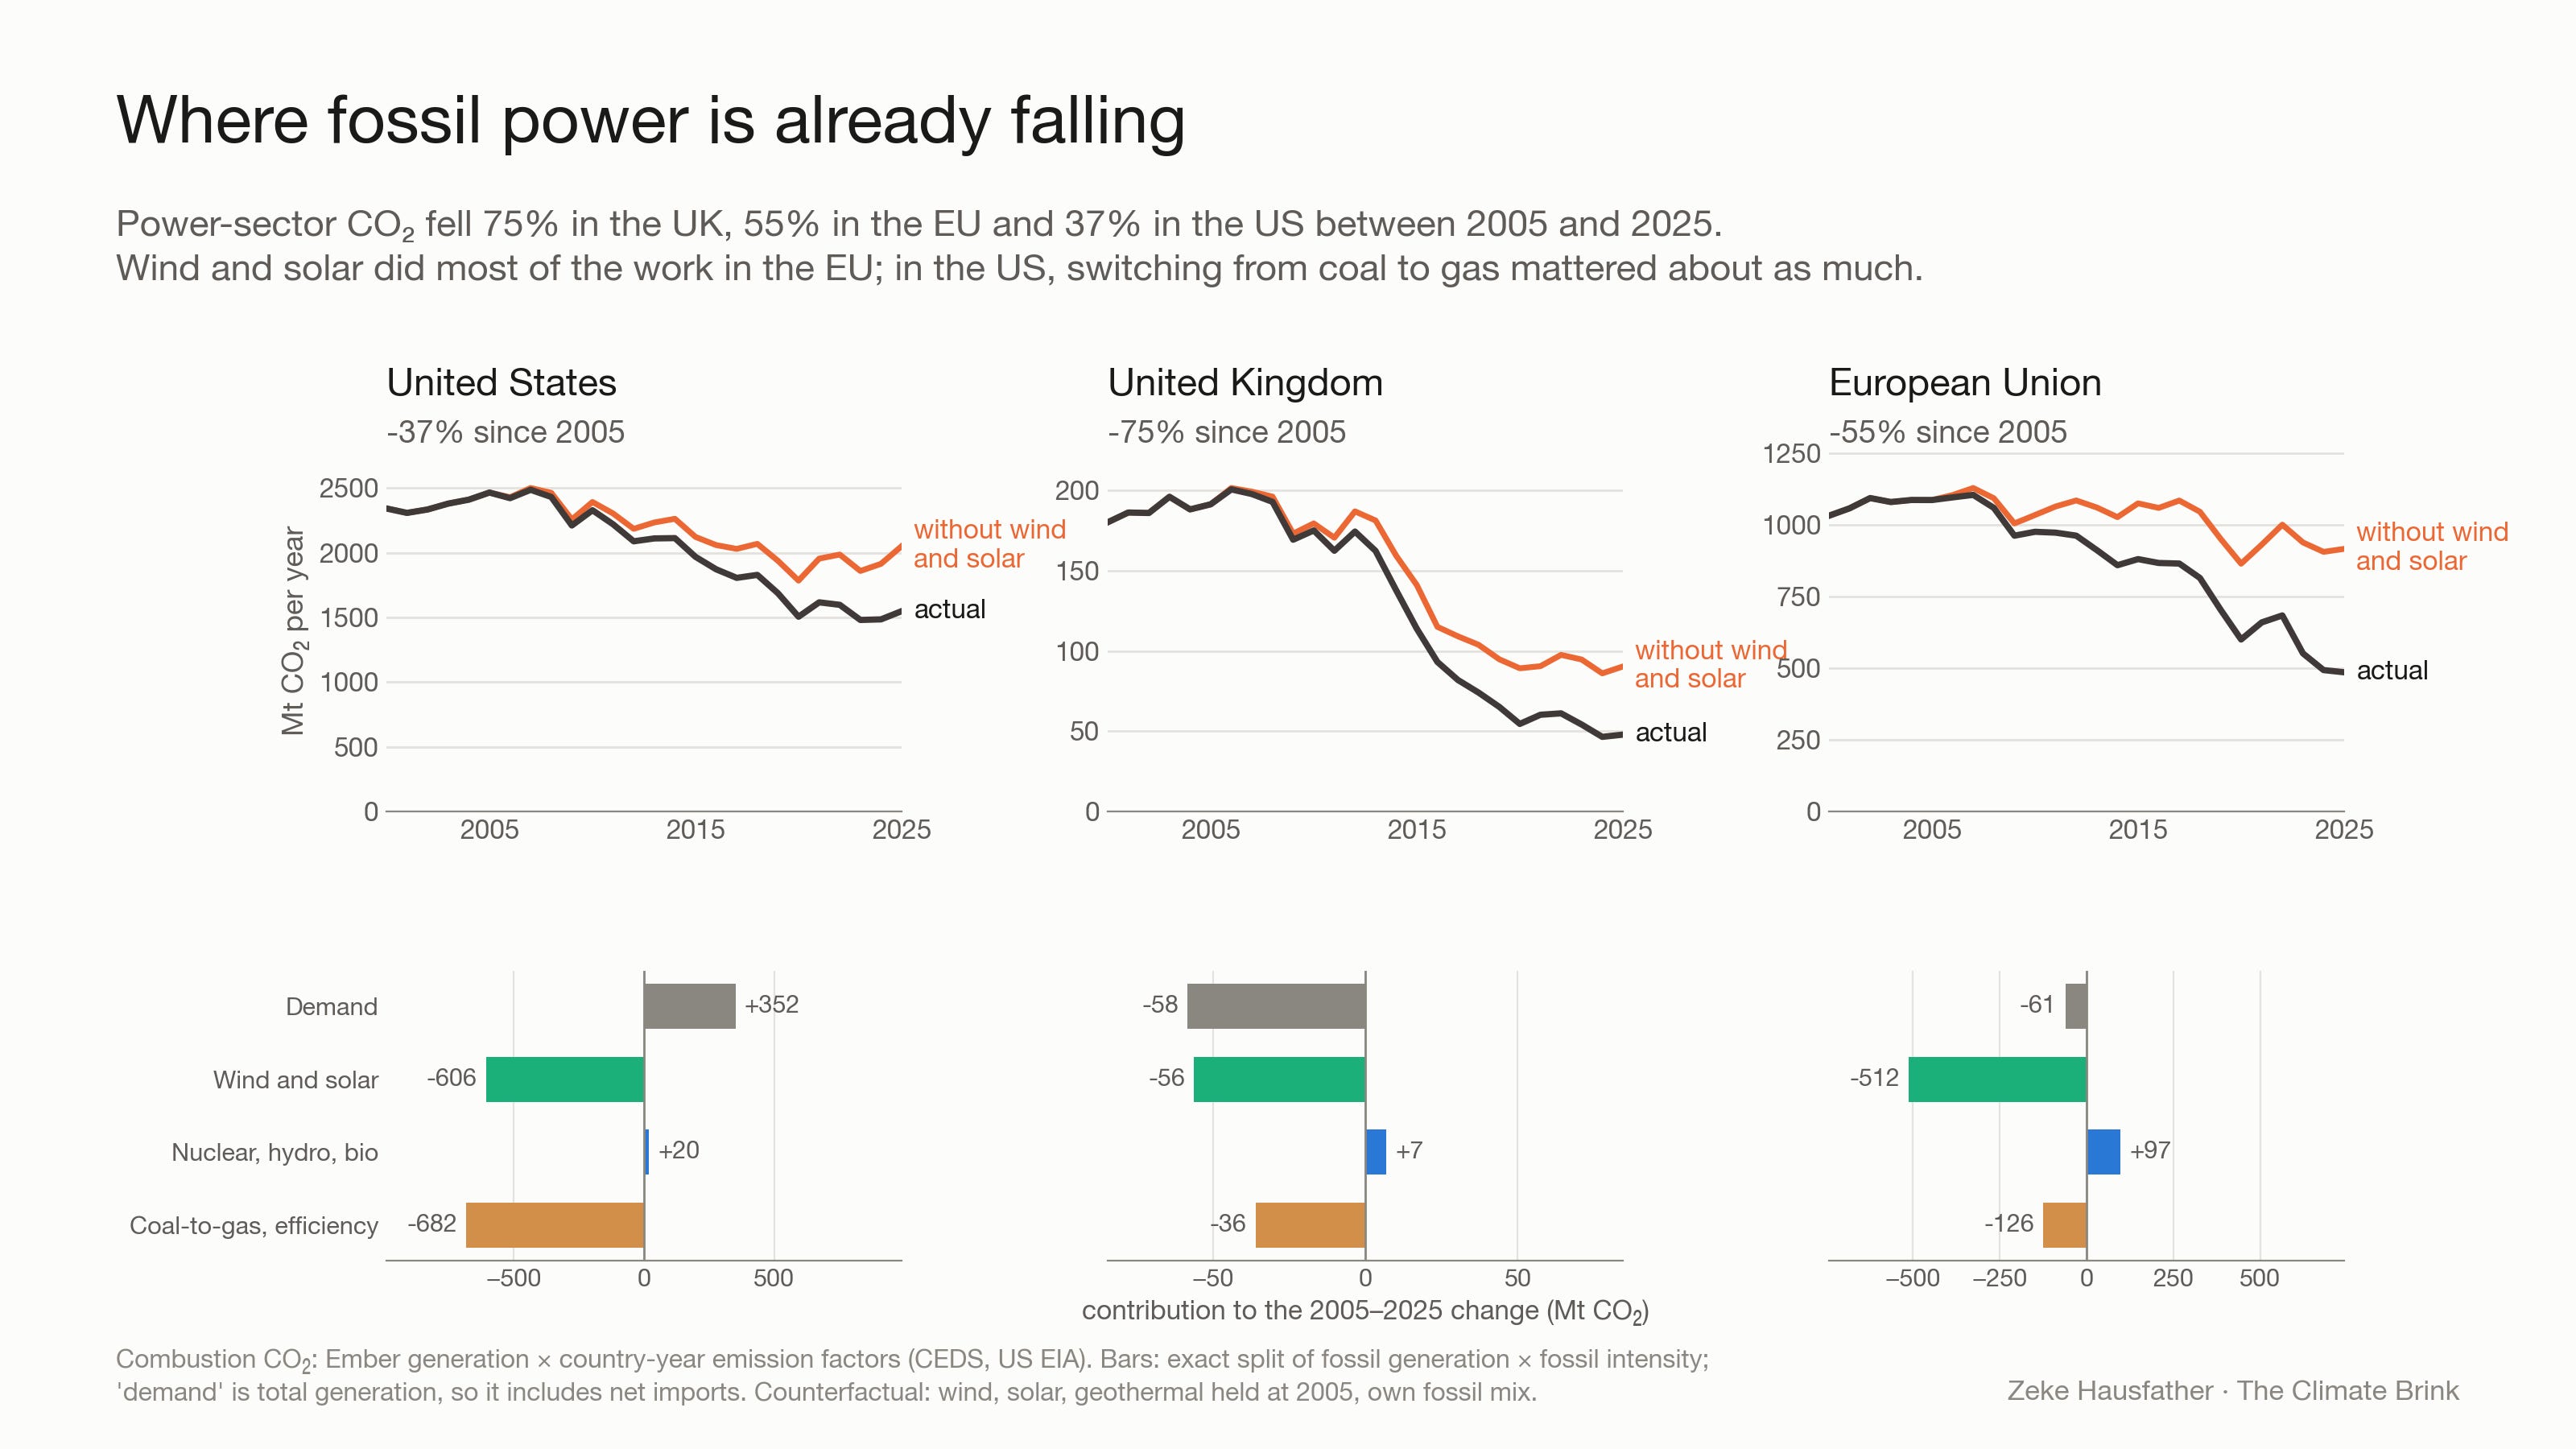
Between 2005 and 2025, power-sector CO2 emissions fell by 75% in the UK, 55% in the European Union and 37% in the United States.
The reasons why differ from place to place:
In the EU, wind and solar account for about 85% of the decline (512 of 601 million tonnes), even though falling nuclear output pushed emissions up by about 100 million tonnes.
In the UK, the decline had three main drivers: wind and solar (56 million tonnes), lower domestic generation (58 million tonnes, partly because the UK now imports more power), and the near-elimination of coal, which went from 45% of UK fossil generation to effectively zero (36 million tonnes).
In the US, switching from coal to cheaper natural gas cut emissions by 682 million tonnes, slightly more than wind and solar (606 million tonnes), while a 12% rise in electricity use added 352 million tonnes. Coal’s share of US fossil generation fell from 69% to 29%.
Without wind and solar growth, EU power emissions would have fallen by only about 16% since 2005 rather than 55%, US emissions by about 17% rather than 37%, and UK emissions by about 53% rather than 75%. In these regions clean energy has not just met new demand, its actually pushed fossil generation down.
What about temperatures?
Avoided emissions translate into avoided warming, but the story here has an important twist. Coal plants don’t just emit CO2. They also emit sulfur dioxide, which forms aerosols that reflect sunlight and cool the planet. A world with more coal would also have had more of this aerosol pollution and the cooling it causes, though exactly how much depends on the use of scrubbers, the sulfur content of the coal, and a number of other factors.
To capture the complex dynamics here, I ran the counterfactual emissions (CO2, sulfur dioxide, nitrogen oxides, black and organic carbon, and methane leaked from coal mines and gas supply chains) through the FaIR climate model, using a 841 parameter ensemble constrained to match the climate sensitivity and carbon cycle feedback values assessed in the IPCC AR6 as well as observed warming.
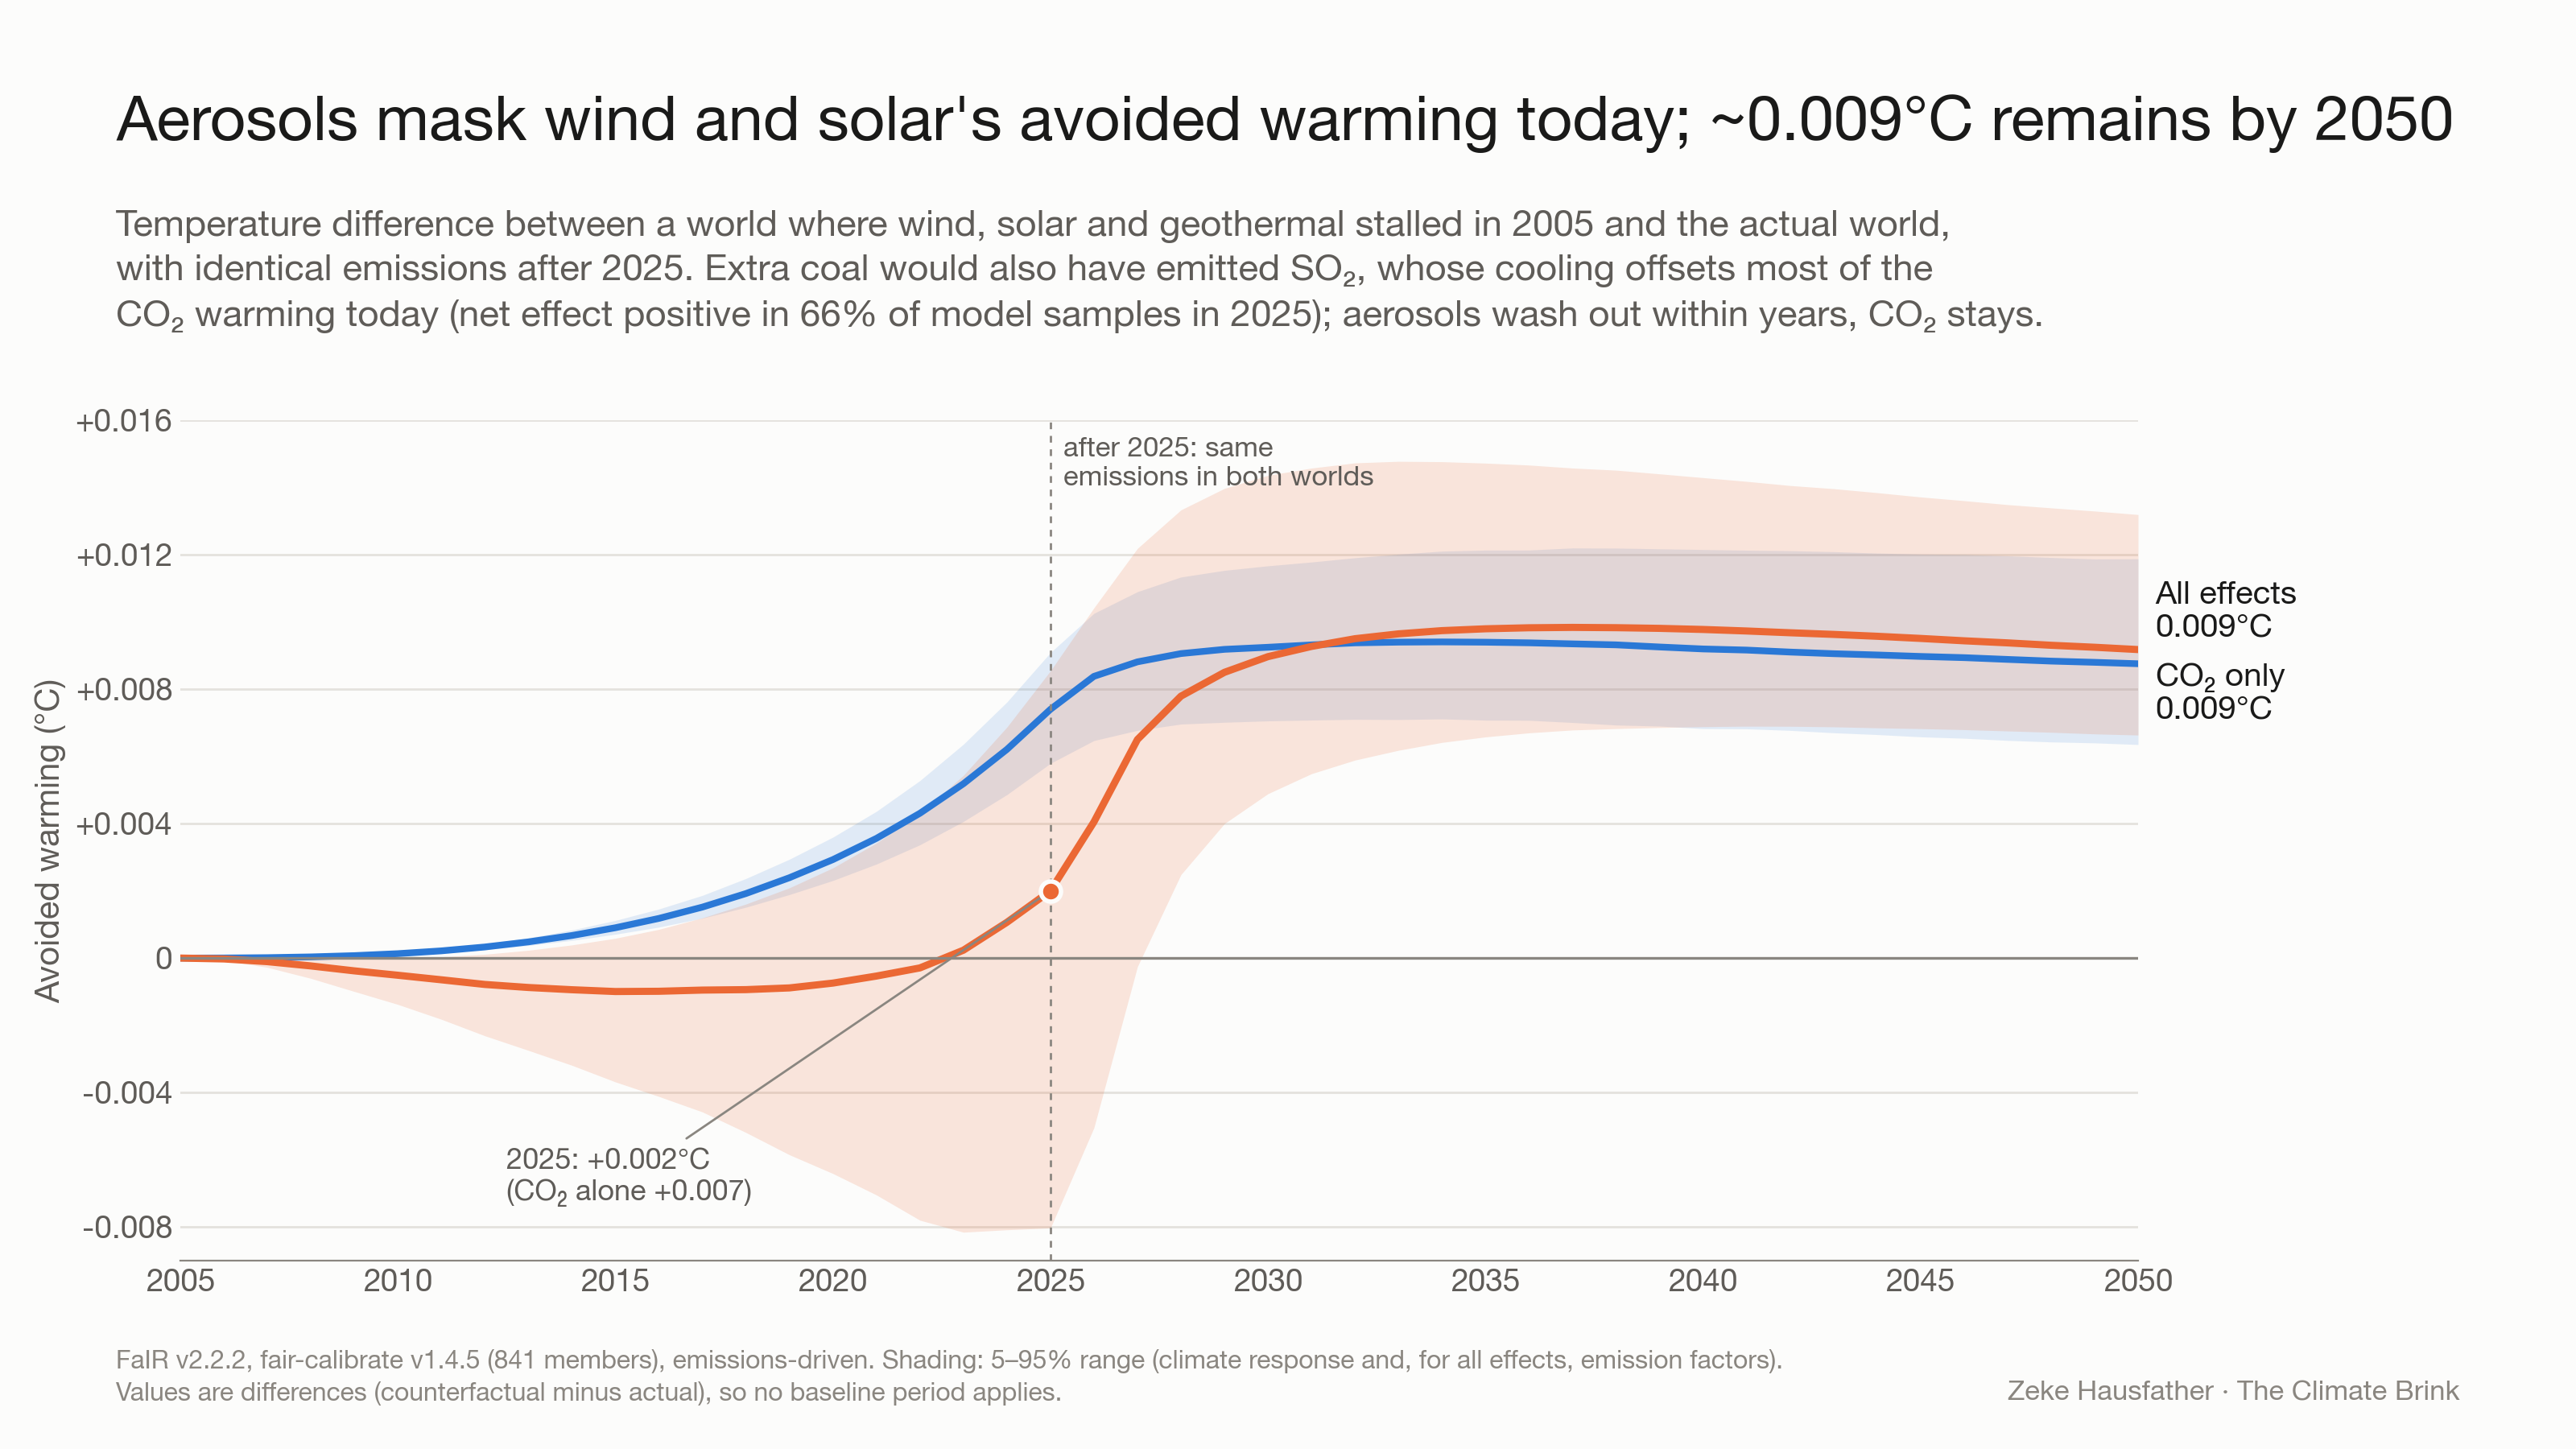
The CO2 avoided by solar and wind growth between 2005 and 2025 has prevented about 0.01C of warming. Adding the methane that would have leaked from the extra coal mining and gas production, the gross effect is larger still. But the extra sulfur that would have been emitted by fossil fuels in that counterfactual world would have masked most of that for now. Taking everything together, the net avoided warming in 2025 is only about 0.002C (−0.008 to +0.009C).
However, this comparison is a bit apples and oranges. Aerosols wash out of the atmosphere within days to weeks, while CO2 persists for centuries (and the warming from CO2 for millennia). Once the extra aerosols clear, the avoided warming from wind and solar deployment to date settles at about 0.01C by 2035. Cooling from sulfur pollution depends on how much is being emitted in a given year, while the warming from CO2 depends on how much has built up over time. So while a new coal plant (in our counterfactual world) would lead to an immediate spike of cooling sulphate aerosols, that effect would be overtaken by warming from CO2 – which will persist long after the coal plant is closed and the cooling from sulfur emissions is gone. Trading a small, temporary cooling from air pollution for permanent warming is a bad bargain, and it comes with catastrophic public health costs of breathing that pollution.
These warming numbers are modest, but they reflect only 20 years of deployment. Much of it is also very recent: 60% of all the emissions wind and solar avoided came in the last five years. The world has emitted roughly 2,600 billion tonnes of CO2 since 1850, so 23 billion tonnes is just under 1% of that total.
More importantly, the 0.01C is only the effect to-date of what has been built so far, assuming the counterfactual world’s extra emissions stopped at the end of 2025. In reality, the wind and solar fleet will keep running and keep growing. At today’s rate, each additional year of operation avoids roughly 3.7 billion tonnes of CO2, and that rate is rising quickly as deployment accelerates.
Addition and displacement at the same time
Clean energy has been an addition to the global power system, but not in the sense the critique implies. It has been added alongside rapidly growing demand that would have existed anyway, and it has displaced fossil generation that would otherwise have been built and burned. Both things are true at once, which is why fossil use can rise while clean energy is still cutting emissions.
Without the wind and solar built since 2005, the world’s power plants would be emitting 28% more CO2 today. Over the long term, the world would be warmer. The warming avoided so far is small (and partly hidden by the side effects of cleaner air), but it grows with every year that clean energy continue producing power. Many countries have already seen their power sector emissions decline, the world as a whole appears to now be on the cusp of absolute declines in electricity sector emissions.
I’ve also put together an animated explainer video that goes through the points of this post to share on other social media channels:
Methods, code and data for this analysis are available over at my GitHub.
The 2026 breakdown here is: 10.3% of global generation from solar, 9.1% from wind, 2.2% from bioenergy, and 0.3% from geothermal. Note that the analysis later in the piece looking at what would have happened without clean energy growth excludes bioenergy from its analysis, given the complexity of emissions accounting there.
There is a mechanism by which clean energy could in principle add to demand: if cheap wind and solar lower electricity prices, people and firms may use more power. That rebound effect is real, but it would need to be enormous to account for demand growth on the scale seen, and lower cost power can also enable emissions reductions through increased electrification (heat pumps, EVs, etc.). Accounting for a rebound would at most modestly reduce the avoided emissions we estimate.
Additional methodological details: Europe is treated as a single interconnected grid, so that Scandinavian wind displaces German and Polish coal and gas rather than fossil plants Sweden doesn’t have. Plants can’t run above realistic capacity factors; where existing plants would be maxed out, the model builds new ones in the fuel each country has been adding. Emissions are calculated from combustion emission factors that vary by country and year, drawn from CEDS, the US EIA and Chinese official statistics, and are net of the emissions from manufacturing the wind turbines and solar panels themselves.
Not all electricity demand increases are a bad thing from an emissions standpoint. Vehicle electrification is driving more demand growth than data centers globally, and that demand is coming at the direct expense of oil consumption (and associated emissions).
It's a fair point, but the obvious problem with counterfactuals is we don't actually know what energy demand would be if more of it hadn't been made available through solar/wind/etc. I imagine it would regardless mean even more co2 output regardless; debatable if it'd be exactly 1:1. Still, from where I'm standing, all that really matters is the actual amount of physical emissions (Which is still going up, and which is much more likely to flatline than net decrease in the next decade or so).