

If you spend any time arguing about climate on the internet, sooner or later someone will show you a graph of global temperatures in the early 20th century. Between 1900 and the mid-1940s the world warmed by around 0.4C, a rapid rise at a time when human emissions of CO2 were only around 15% of today’s levels. The implication (sometimes stated, sometimes just implied) is that if the world could warm that quickly back then, maybe the modern warming isn’t fully human-driven after all.
It’s a fair question, and one that climate scientists have spent a fair amount of effort studying. The early 20th century warming is genuinely interesting: it was fast, it shows up in every surface temperature dataset we have, and no single factor can explain it. But when we actually decompose the drivers, the story that emerges is quite different from the skeptic framing: between a quarter and half of the warming comes from greenhouse gases, with sizable contributions from natural forcings and (likely) internal variability, and is partially offset by human emissions of aerosols.
For this analysis I used the FaIR reduced-complexity climate model driven by historical emissions to attribute 1900–1945 warming to individual forcings, and compare the results against six different observational surface temperature datasets.
A note on the choice of period before we dig in: I am deliberately using 1900–1945 and measuring warming with linear trends to give the early-century warming its strongest case. The period ends right on the mid-1940s warm peak, and if you scan every possible start and end year in the early record, windows ending around 1945 are the ones that maximize the apparent warming.1 This is, in other words, a somewhat cherry-picked assessment of the early 20th century warming.
To start with, let’s put the early 20th century warming in context. The figure below shows global mean surface temperatures since 1850, with linear trends fit to the 1900–1945 period and the modern warming era (1970–2025):
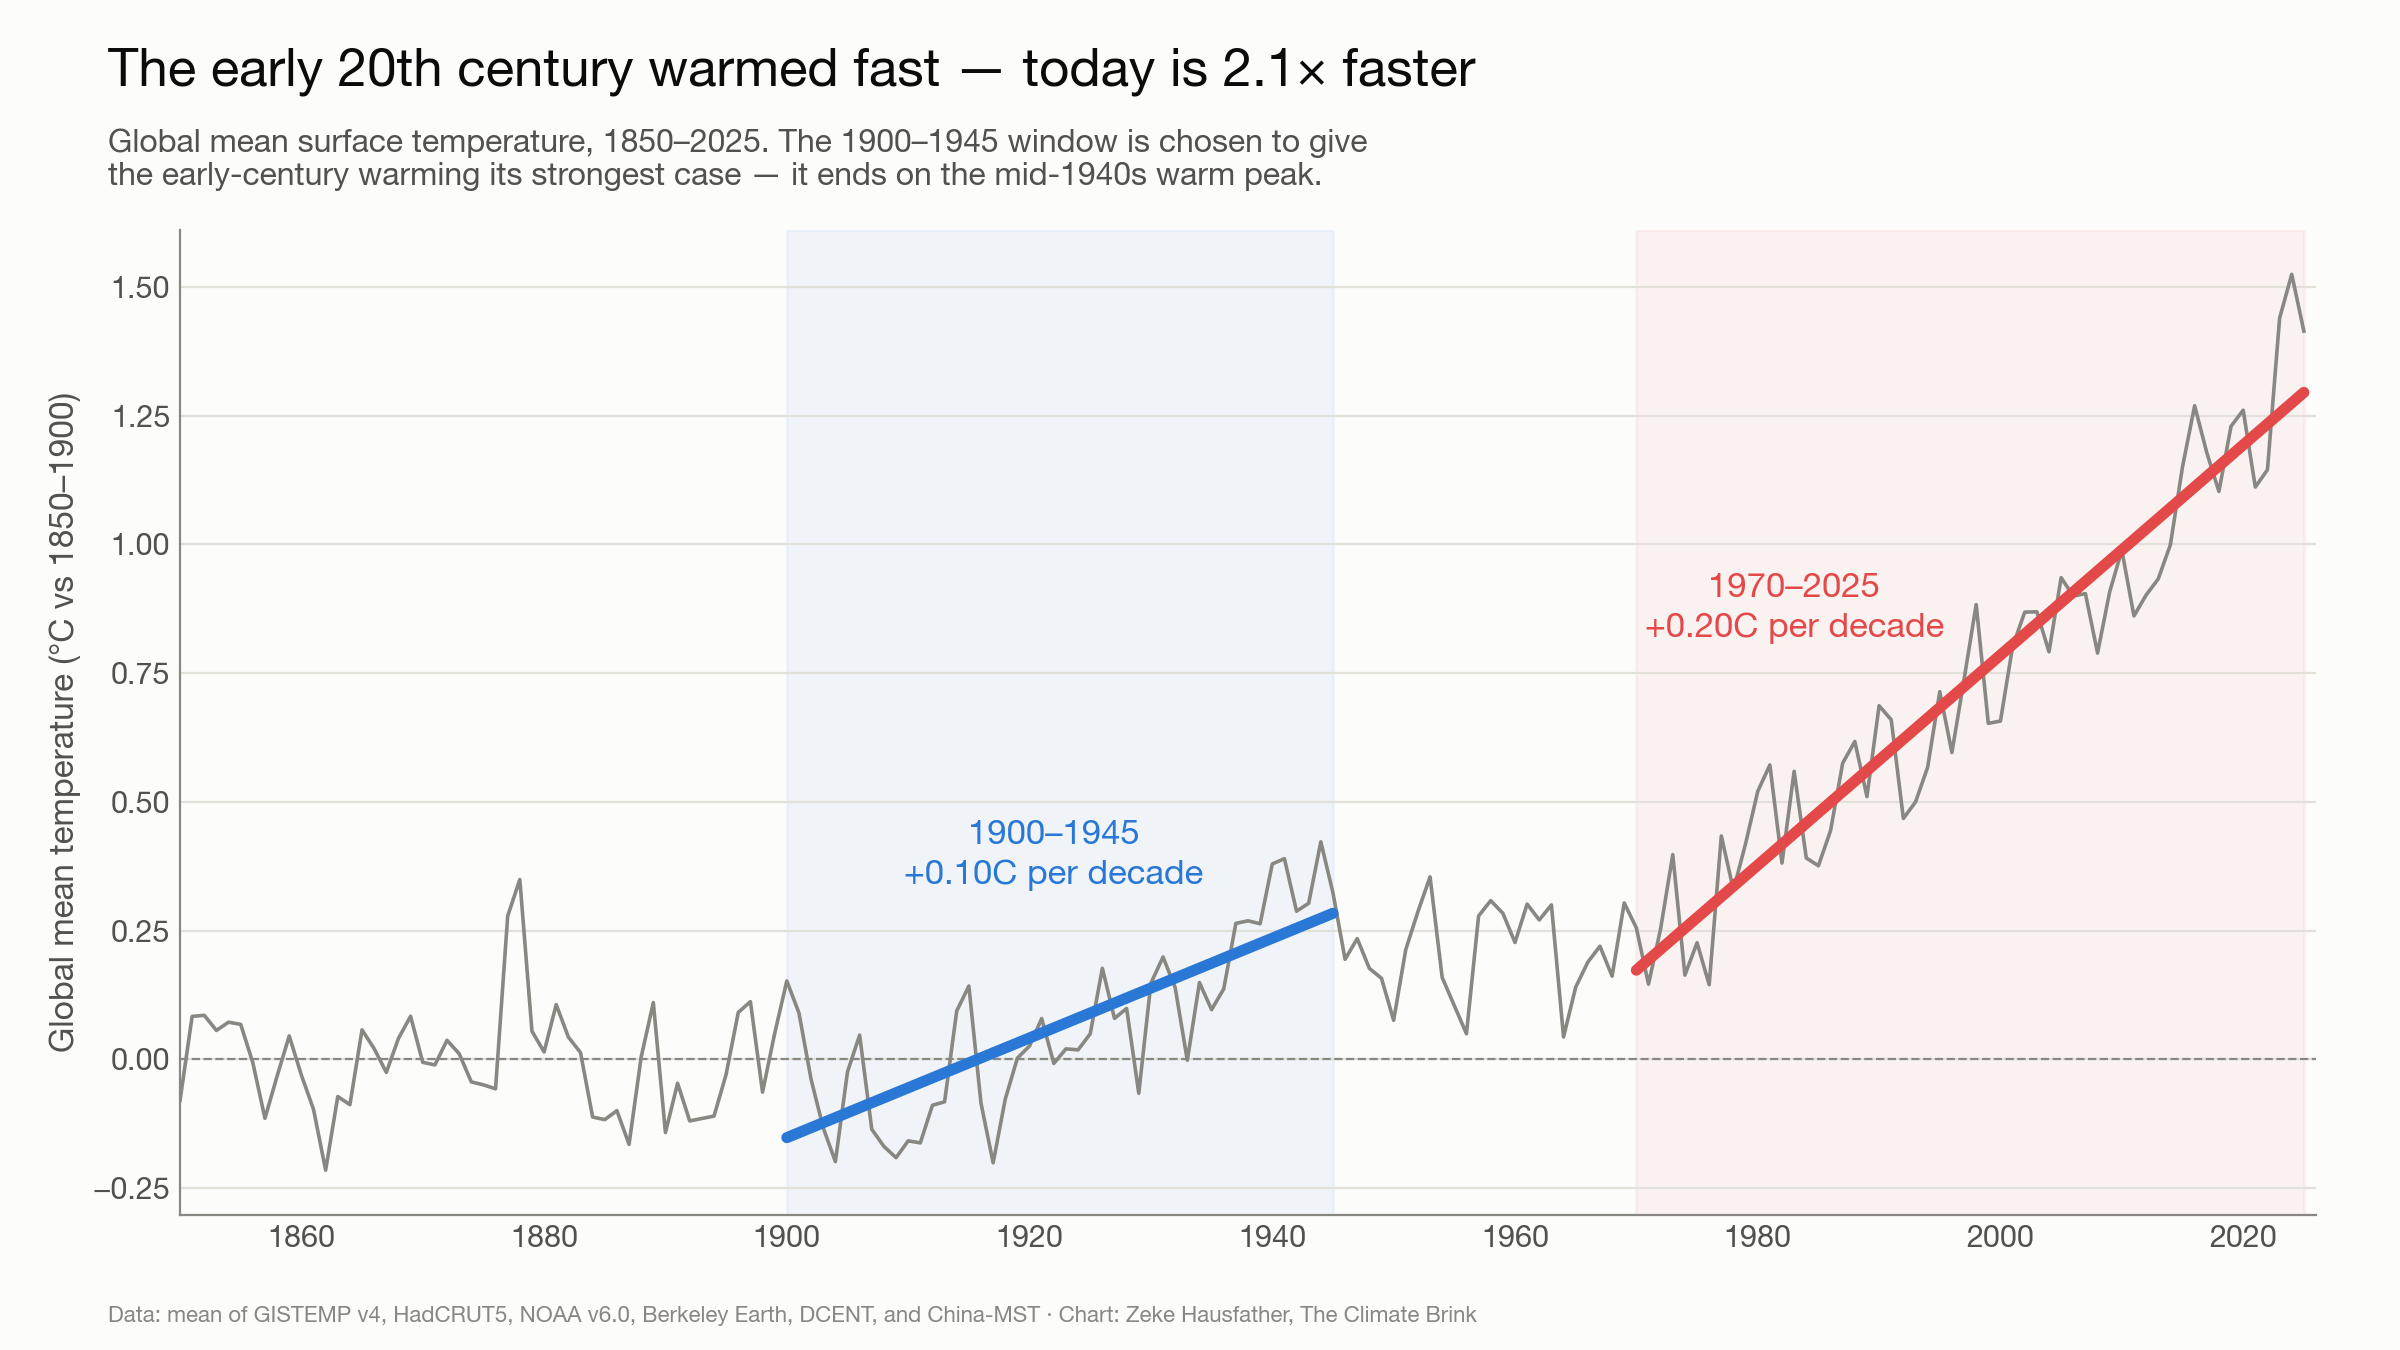
The world warmed at around 0.1C per decade between 1900 and 1945. That was fast for its day, but is only half the 0.2C per decade we have experienced since 1970.
Decomposing the drivers
To attribute the early-century warming to individual forcings (CO2, CH4, other greenhouse gases, aerosols, other anthropogenic forcings, and natural forcings, I ran the FaIR calibrated constrained ensemble in emissions-driven mode using historical emissions through 2025, then re-ran it with each forcing category removed in turn. The difference between the all-forcing run and each removal run gives the warming attributable to that category, with an 841-member ensemble sampling from the parameter space to calculate uncertainties.2
The figure below shows the resulting linear-trend warming over 1900–1945 for each forcing, alongside the total modeled warming and the observed warming across the six datasets:
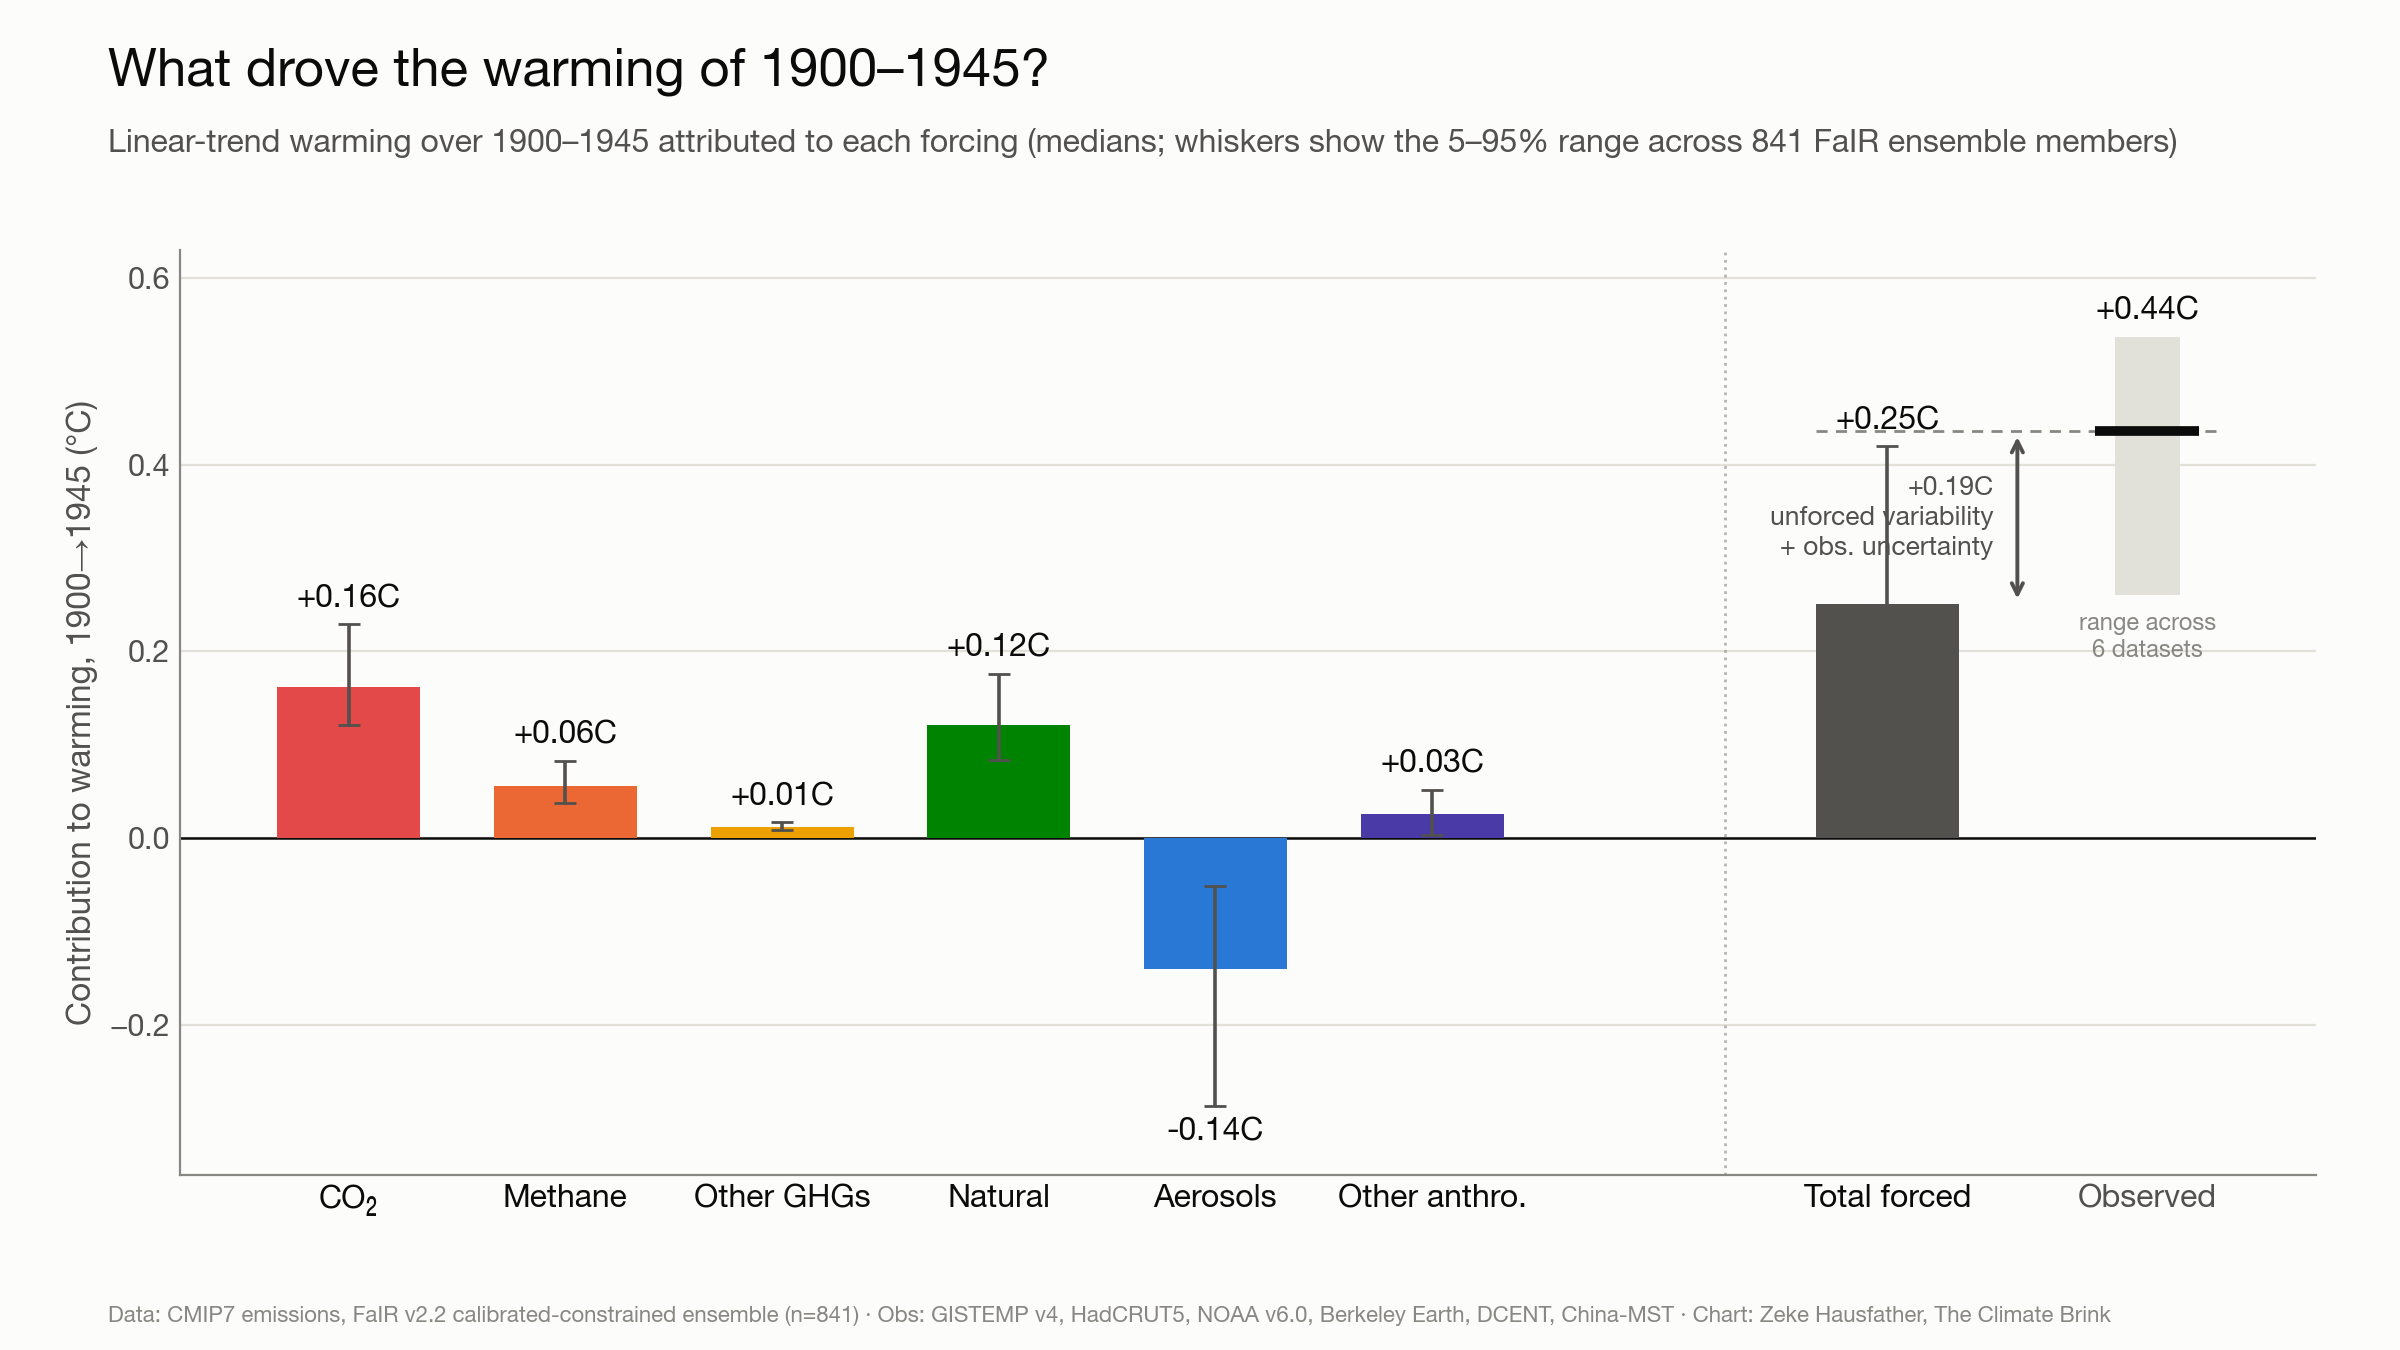
A few things stand out here. First, human emissions of greenhouse gases were already contributing to a meaningful amount of warming by the 1940s: CO2 contributed around 0.16C (0.12C to 0.23C) of warming over the period, with methane adding another 0.06C. This shouldn’t be too surprising, as atmospheric CO2 had already risen from ~285 ppm in the mid-1800s to ~310 ppm by 1945.
Second, natural forcings gave the early 20th century a substantial helping hand of around 0.12C (0.08C to 0.18C), the second largest positive contribution after CO2. This mostly reflects the recovery from a cluster of volcanic eruptions in the early 1900s (Santa María in 1902, Novarupta/Katmai in 1912), along with a modest increase in solar output. And note that this is partly an artifact of our cherry-picked window: starting the period in the volcanically-cooled 1900s means some of the “warming” is just the climate returning to where it would have been anyway. The stacked attribution below shows how this played out over time — you can clearly see the two volcanic dips followed by three decades with essentially no major eruptions:
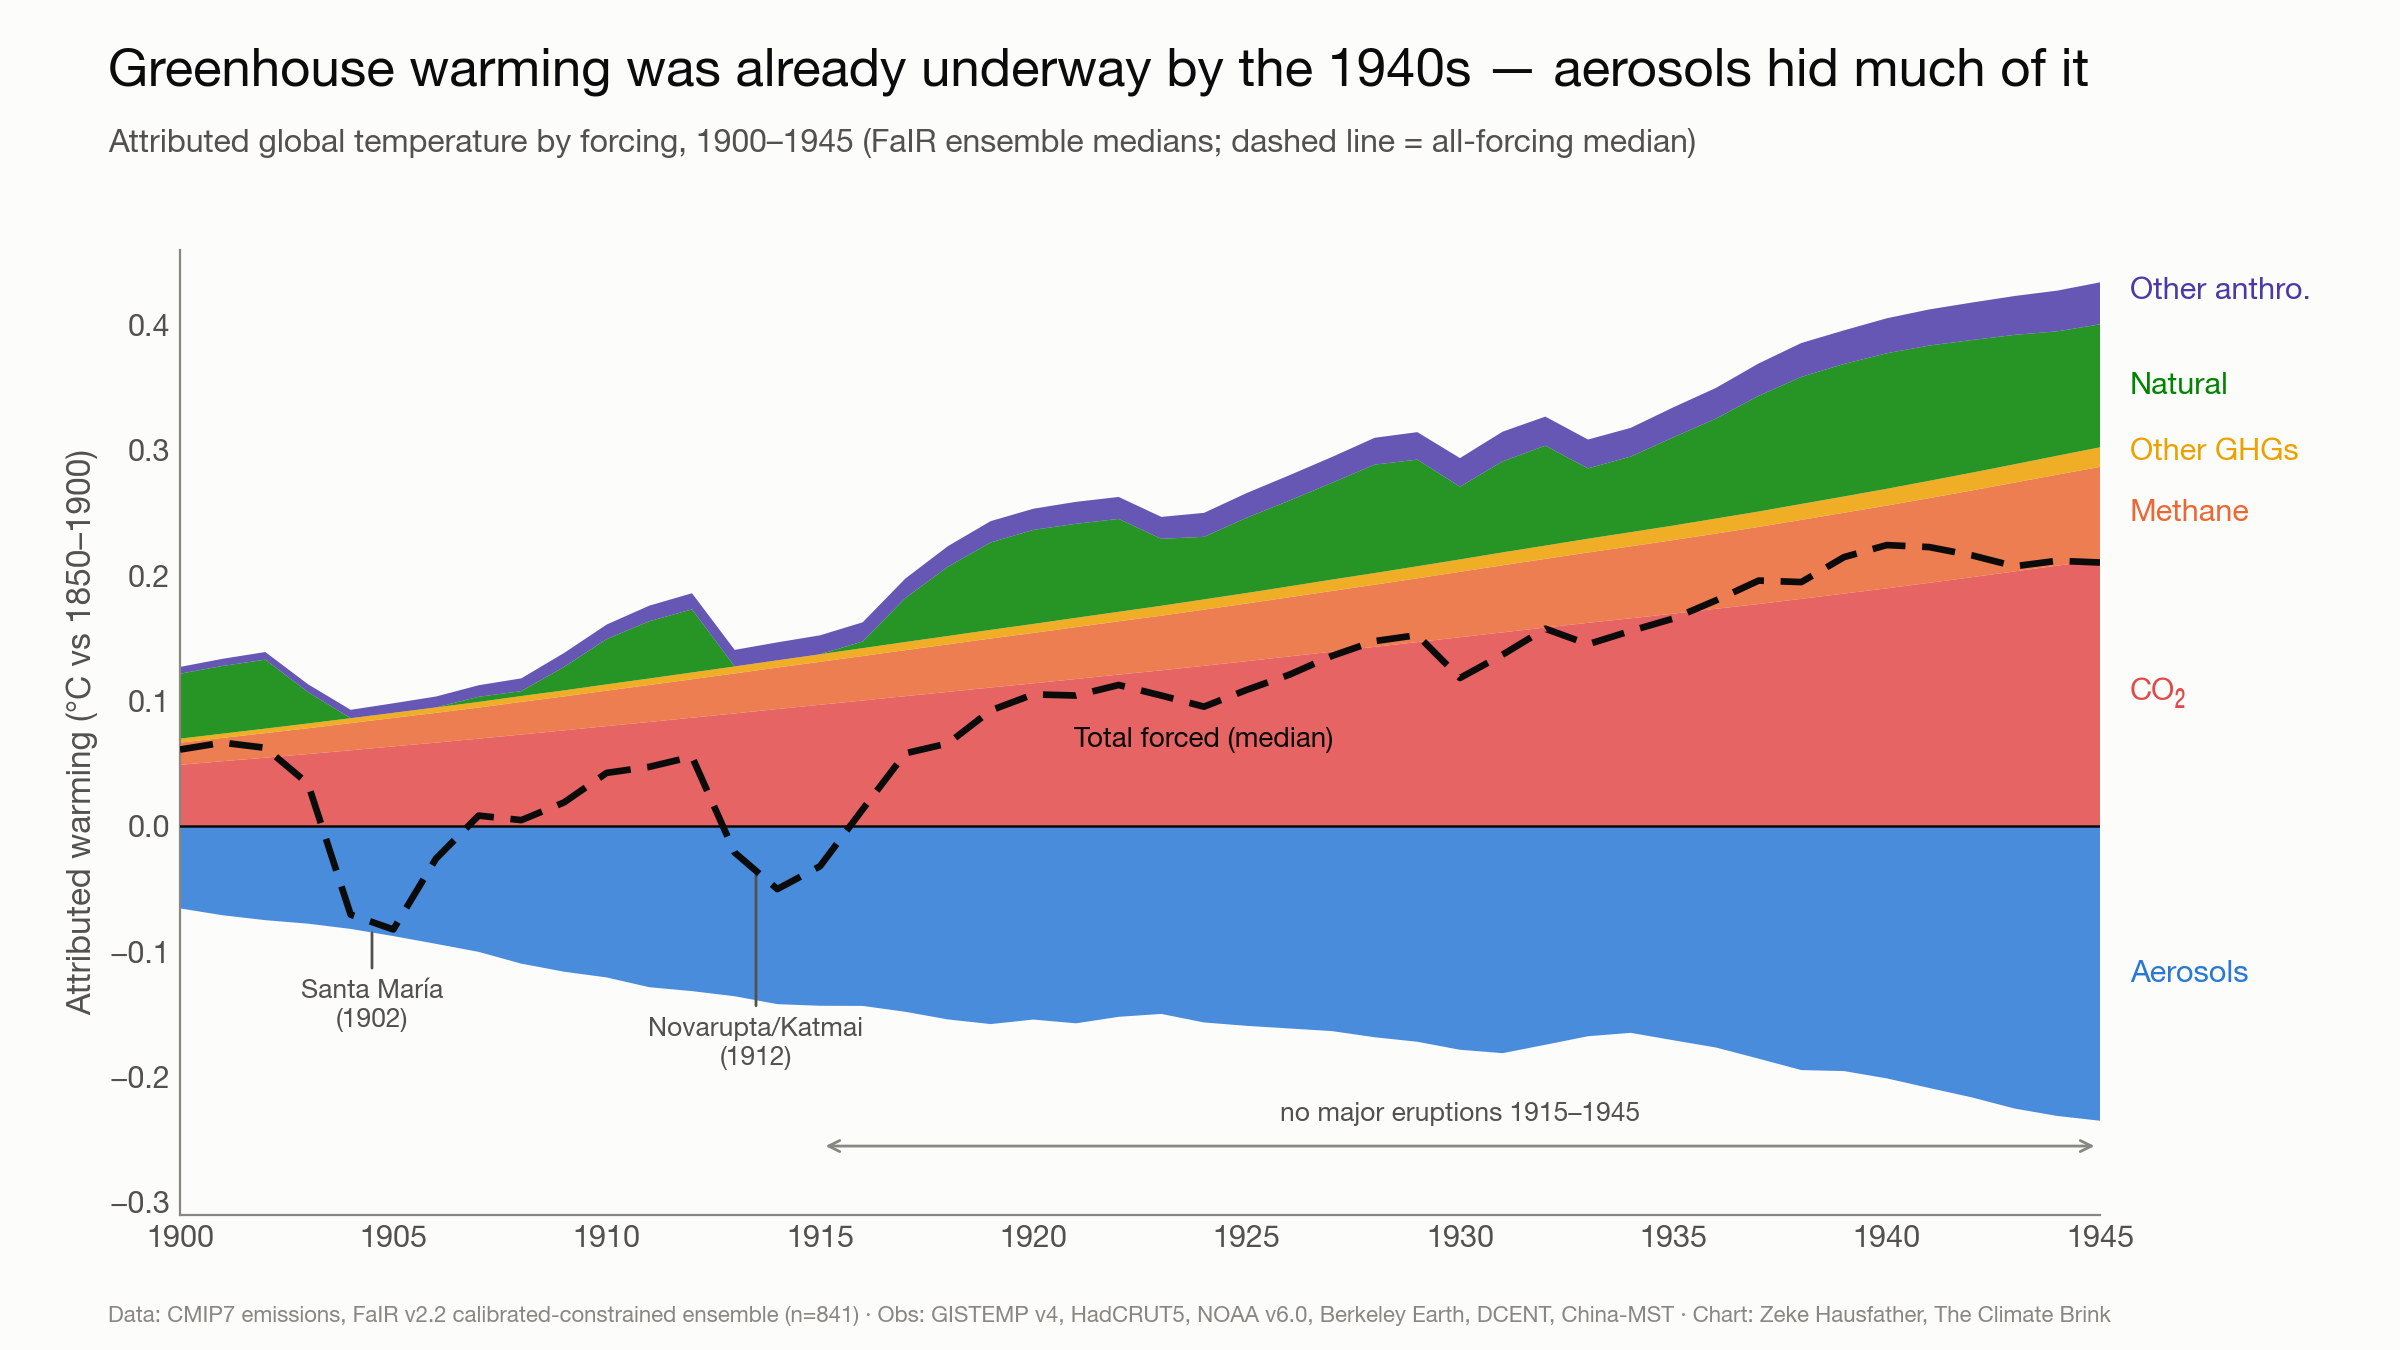
Third, aerosols were contributing to a notable amount of cooling. Growing sulfur emissions from coal burning offset around 0.14C (0.05C to 0.29C) warming over the period, masking roughly 60% of the contribution of CO2 and other greenhouse gases. This is the same tug-of-war between GHGs and aerosols that has shaped the entire historical temperature record; even in the early 20th century the greenhouse side was winning, just not by much.
Adding everything up, the total forced response in FaIR is around 0.25C (0.11C to 0.42C) of warming from 1900 to 1945, of which about half is attributable to human forcings and half to natural forcings. That is meaningfully less than the ~0.44C warming we see in the observations. The difference between the estimated externally forced warming and observed warming of ~0.19C is consistent with what more sophisticated detection and attribution studies have found: the early 20th century warming was likely given a substantial boost from internal variability, particularly warmth in the North Atlantic (the Atlantic Multidecadal Oscillation) and an unusual run of El Niño-ish conditions in the late 1930s and early 1940s. Forty-five years is a short enough period that multidecadal ocean variability can still matter a lot.
How well do we actually know the early-century warming?
There is one more wrinkle in the story that we need to explore: it turns out that we are much less certain about how much the world warmed from 1900 to 1945 than we are about modern warming. The figure below compares six surface temperature datasets with full early-century coverage:
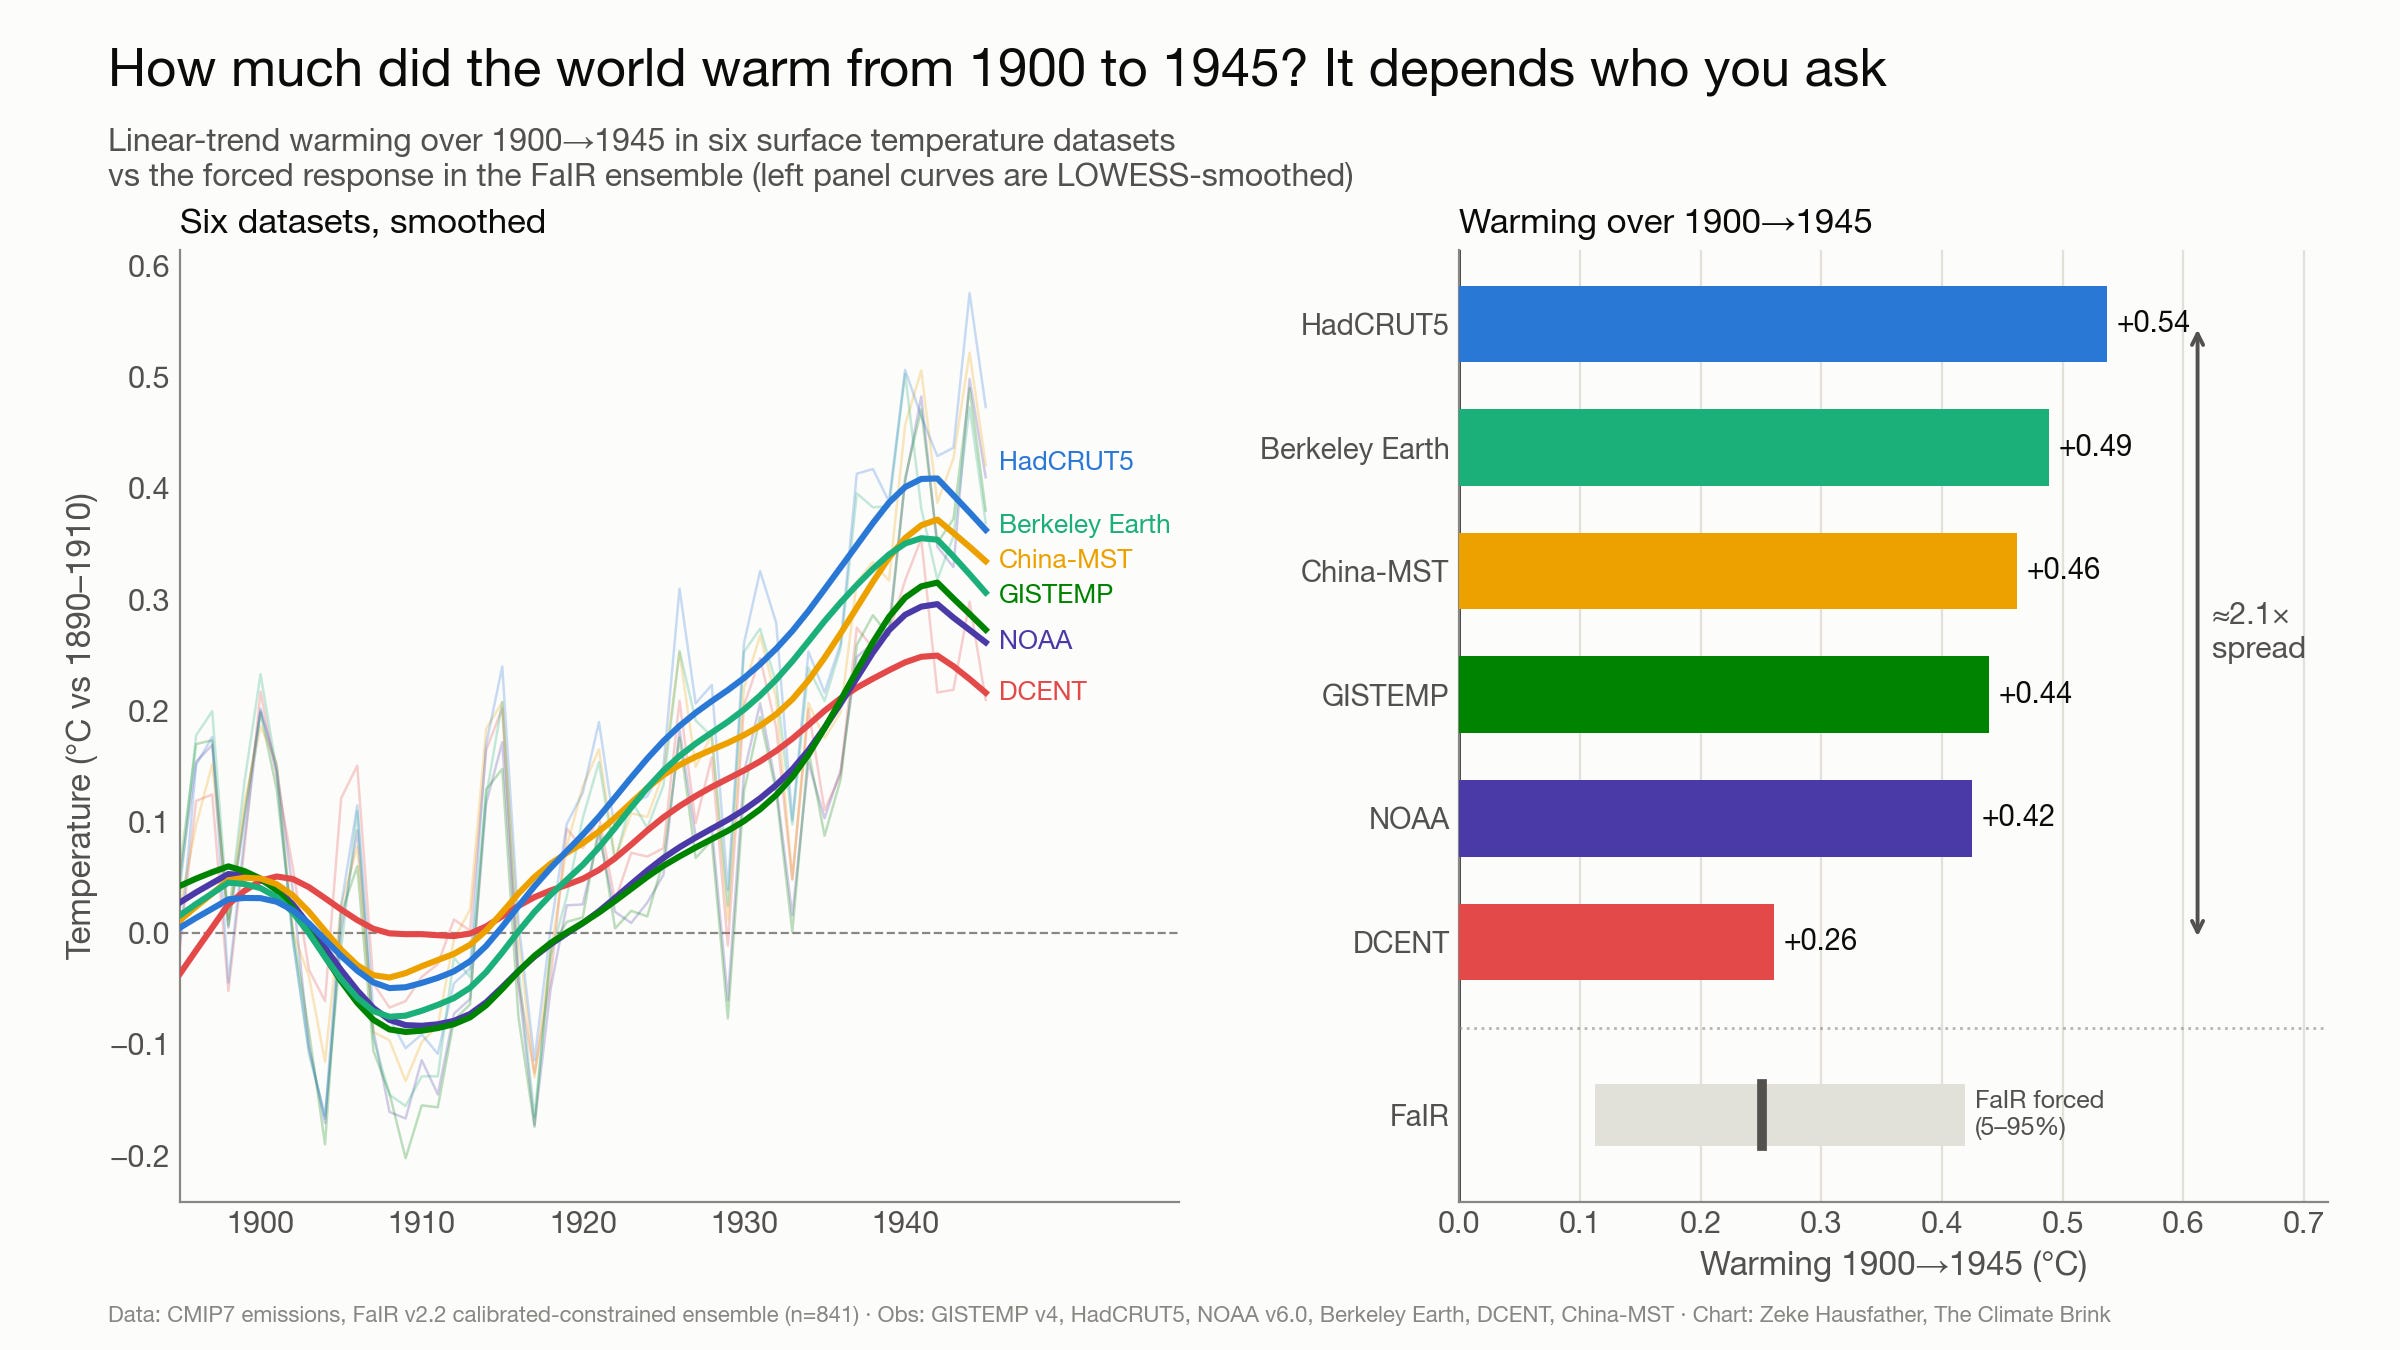
The spread is remarkable: DCENT shows around 0.26C of warming over the period while HadCRUT5 shows 0.54C, more than a factor of two. For comparison, the same datasets agree on the 1970–2025 trend to within about 10%.
The culprit is mostly the ocean. Early 20th century sea surface temperatures were measured by ships hauling up buckets of seawater (canvas, wooden, or insulated, each with different cooling biases), which in turn transitioned to engine room intake measurements at different rates in different fleets. There was a particularly messy discontinuity around World War II where both the composition of fleets rapidly changed and the number of available observations dramatically declined. That wartime data problem matters a lot since the period we are examining ends in 1945; it is quite possible that part of the mid-1940s warm peak may be an artifact of the rapid wartime shift in measurement methods. Different groups make different (defensible) choices about how to correct these biases, and those choices matter far more in 1920 than they do in 2020. The new DCENT dataset, which applies a different approach to homogenizing early ship data, notably shows the least early-century warming. If it is closer to the truth, the gap between the forced response and observations largely disappears, leaving less need to invoke internal variability at all.
So any answer to the question of “what caused the early 20th century warming?” comes with real error bars, on both the model side and the observational side.
So what are the takeaways?
The early 20th century warming is not an unsolved mystery that undermines climate attribution. It was caused by rising greenhouse gases (contributing ~0.23C of forced warming, before aerosol offsets), recovery from early-century volcanic eruptions, a slightly brighter sun, and at least some multi-decadal internal variability (though exactly how much remains unclear given uncertainties in the observations). The modern era is fundamentally different: since 1970, natural forcings have been roughly flat, internal variability averages out over the longer period, and greenhouse gases explain essentially all of the observed warming.
The same aerosol masking that counterbalanced warming from greenhouse gases early in the century is now running in reverse. As air quality regulations cut sulfur emissions, warming from greenhouse gases is being unmasked. The early 20th century is a useful reminder that the temperature record is a story of many different counterbalancing factors rather than CO2 alone.
So next time someone shows you the run-up to the mid-1940s and argues that today’s warming is just more of the same, you can show them this article. Even taking the most generous possible period for the early warming, human emissions an important contributor, and the world warmed at 0.1C per decade. Today they are essentially the whole story, and we are warming at least twice as fast.
Specifically, scanning all start/end pairs between 1890 and 1950, the window that maximizes total warming is 1907–1945 (+0.51C) as it starts at a low point after the Santa María and Novarupta eruptions and ends at the WWII-era peak. I’ve kept the round 1900 start (which predates the volcanic dips and is analogous to the round 1970 start of the modern warming period) but adopted the trend-maximizing 1945 endpoint. The trend calculation approach also matters a bit here: linear trends over 1900–1945 give larger values than smoothed trends (using LOWESS), because the smoothed record peaks around 1943 and declines slightly by 1945.
The attribution runs are forcing-driven, using the total effective radiative forcing from the emissions-driven run with each category’s forcing removed. Warming is measured for both models and observations as the linear trend over 1900 to 1945 (slope * 45 years), computed per ensemble member. The individual category estimate add up to within ~0.02C of the all-forcing run over this period, so nonlinearities are small. Code and data to reproduce this analysis are available on my GitHub.
Damn, I have always wondered about that!
Novarupta-Katmai eruption (13-15km3) was bigger than Pinatubo (10km3), but higher latitude (Kodiak Island), while Santa Maria in Guatemala was about the same size eruption and latitude as Pinatubo.
Interesting, I've studied glacier response in Greenland, were the 1930's warming is particularly well expressed (e.g. https://doi.org/10.1029/2019GL085954). From the literature, I had gathered the warming was mostly attributed to AMO. Wish I'd known this during my PhD!