
Plateauing CO2 emissions have slowed atmospheric growth
CO2 concentrations have continued to increase – but more slowly than they otherwise would have

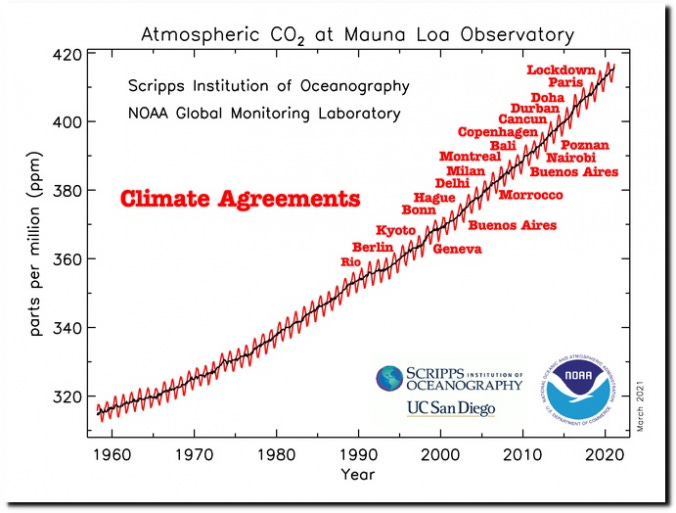
I’ve often come across graphs on social media showing atmospheric CO2 concentrations over time, with various dates of climate agreements highlighted. Shared by doomers and skeptics alike, they are used to argue that the rise of CO2 concentrations is inexorable and has not (or perhaps cannot) be slowed by actions we take.
On the other hand global CO2 emissions – the very precursors to those concentrations – have largely plateaued. After increasing by more than 20% in the 2000s, CO2 emissions today are a mere 3% higher than they were in 2013. This plateau has been driven in part by a rapid expansion of clean energy globally, with spending on clean energy rising from around $600 billion in 2020 to $2.3 trillion in 2025. At the same time we’ve seen notable reductions in land use emissions associated with reduced rates of deforestation in countries like Brazil.

So if global CO2 emissions are flattening, why do atmospheric concentrations appear to be growing unabated? The answer is in the persistent nature of atmospheric CO2.
About half of the CO2 humans emit into the atmosphere remains there for at least a century (and about 20% for more than 10,000 years), with the remainder being absorbed by land (mostly vegetation) and ocean (mostly geochemical) carbon sinks. This means that even with flat CO2 emissions we would expect atmospheric CO2 concentrations to increase – that concentrations are approximately the integral of annual emissions.
This means that, generally speaking, if emissions remain flat concentrations would linearly increase. If emissions increase, concentration growth accelerates, while if emissions fall, concentration growth slows down. Its a bit more complicated in practice – unlike for temperatures we can get atmospheric CO2 concentrations to fall if emissions are reduced enough, where sinks take up more CO2 than we emit. But broadly speaking we expect atmospheric CO2 to keep growing until we cut emissions pretty substantially (e.g. to <50% of current levels).
Either way, atmospheric CO2 is better seen as a lagging rather than leading indicator of changes in emissions, as it is harder to see the effects of emissions reductions on concentrations over shorter time periods.
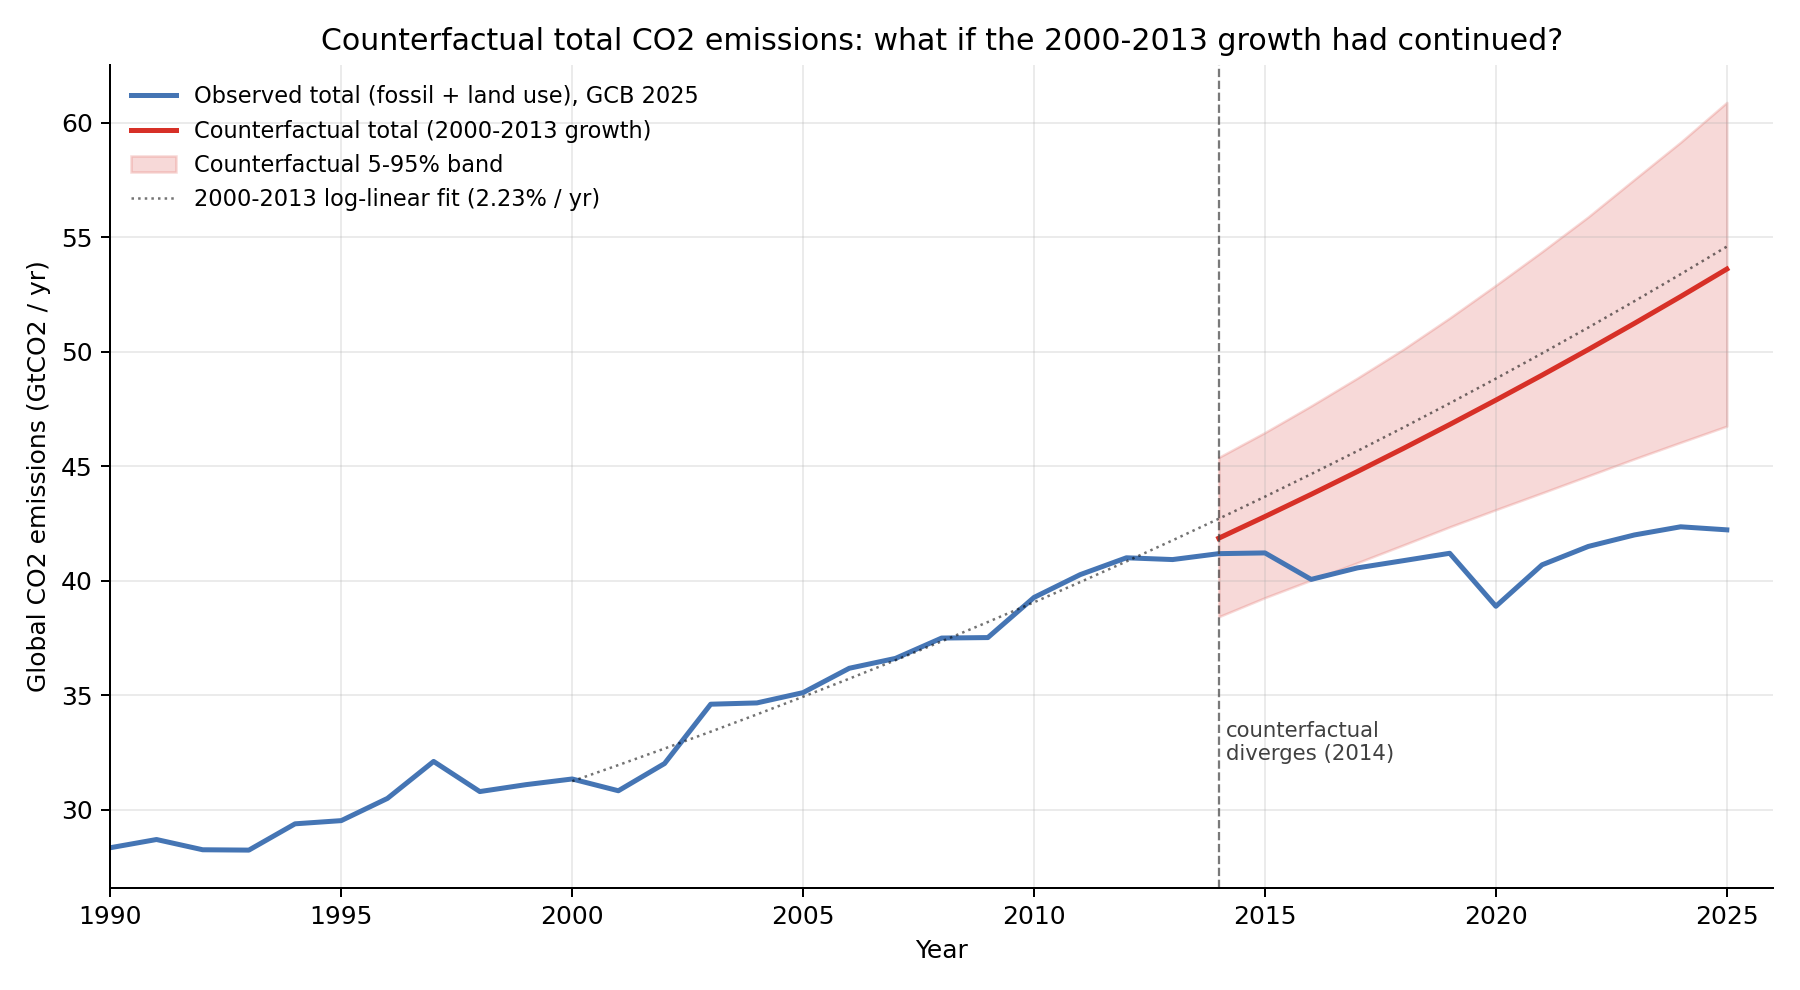
What we can do, however, is use reduced-complexity carbon-cycle models to examine how different atmospheric CO2 concentrations would have been if global emissions had not plateaued. To start with, lets assess what would have happened to global CO2 emissions if they had continued increasing at the ~2.2% per year that we saw in the 2000s. This is shown in the figure below.
Next lets use a reduced complexity carbon cycle model to convert these additional emissions into atmospheric concentrations. Here I am using the Joos et al (2013) impulse response function which describes the fraction of a one-year pulse of CO₂ that stays in the atmosphere as the ocean and land sinks gradually draw it down. These pulses are then convolved into changes in atmospheric concentrations over time.
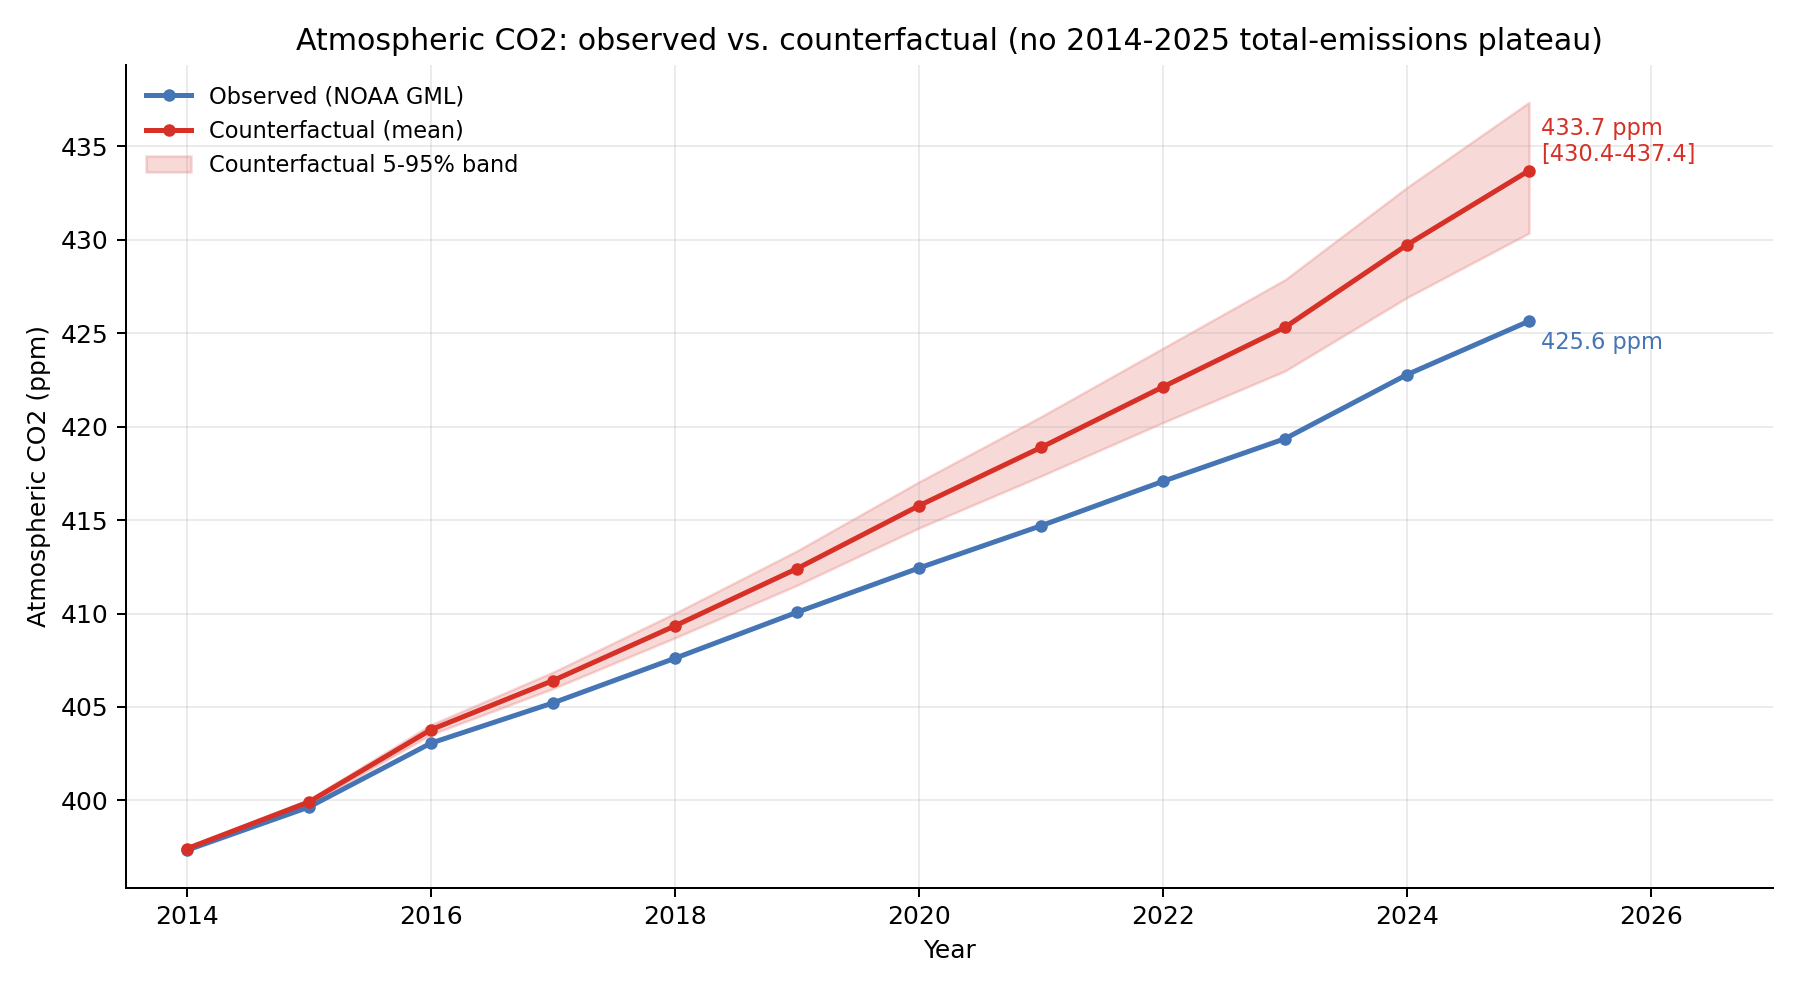
Here we see that atmospheric CO2 concentrations would have been approximately 8 ppm higher if global emissions had not plateaued over the past 13 years.
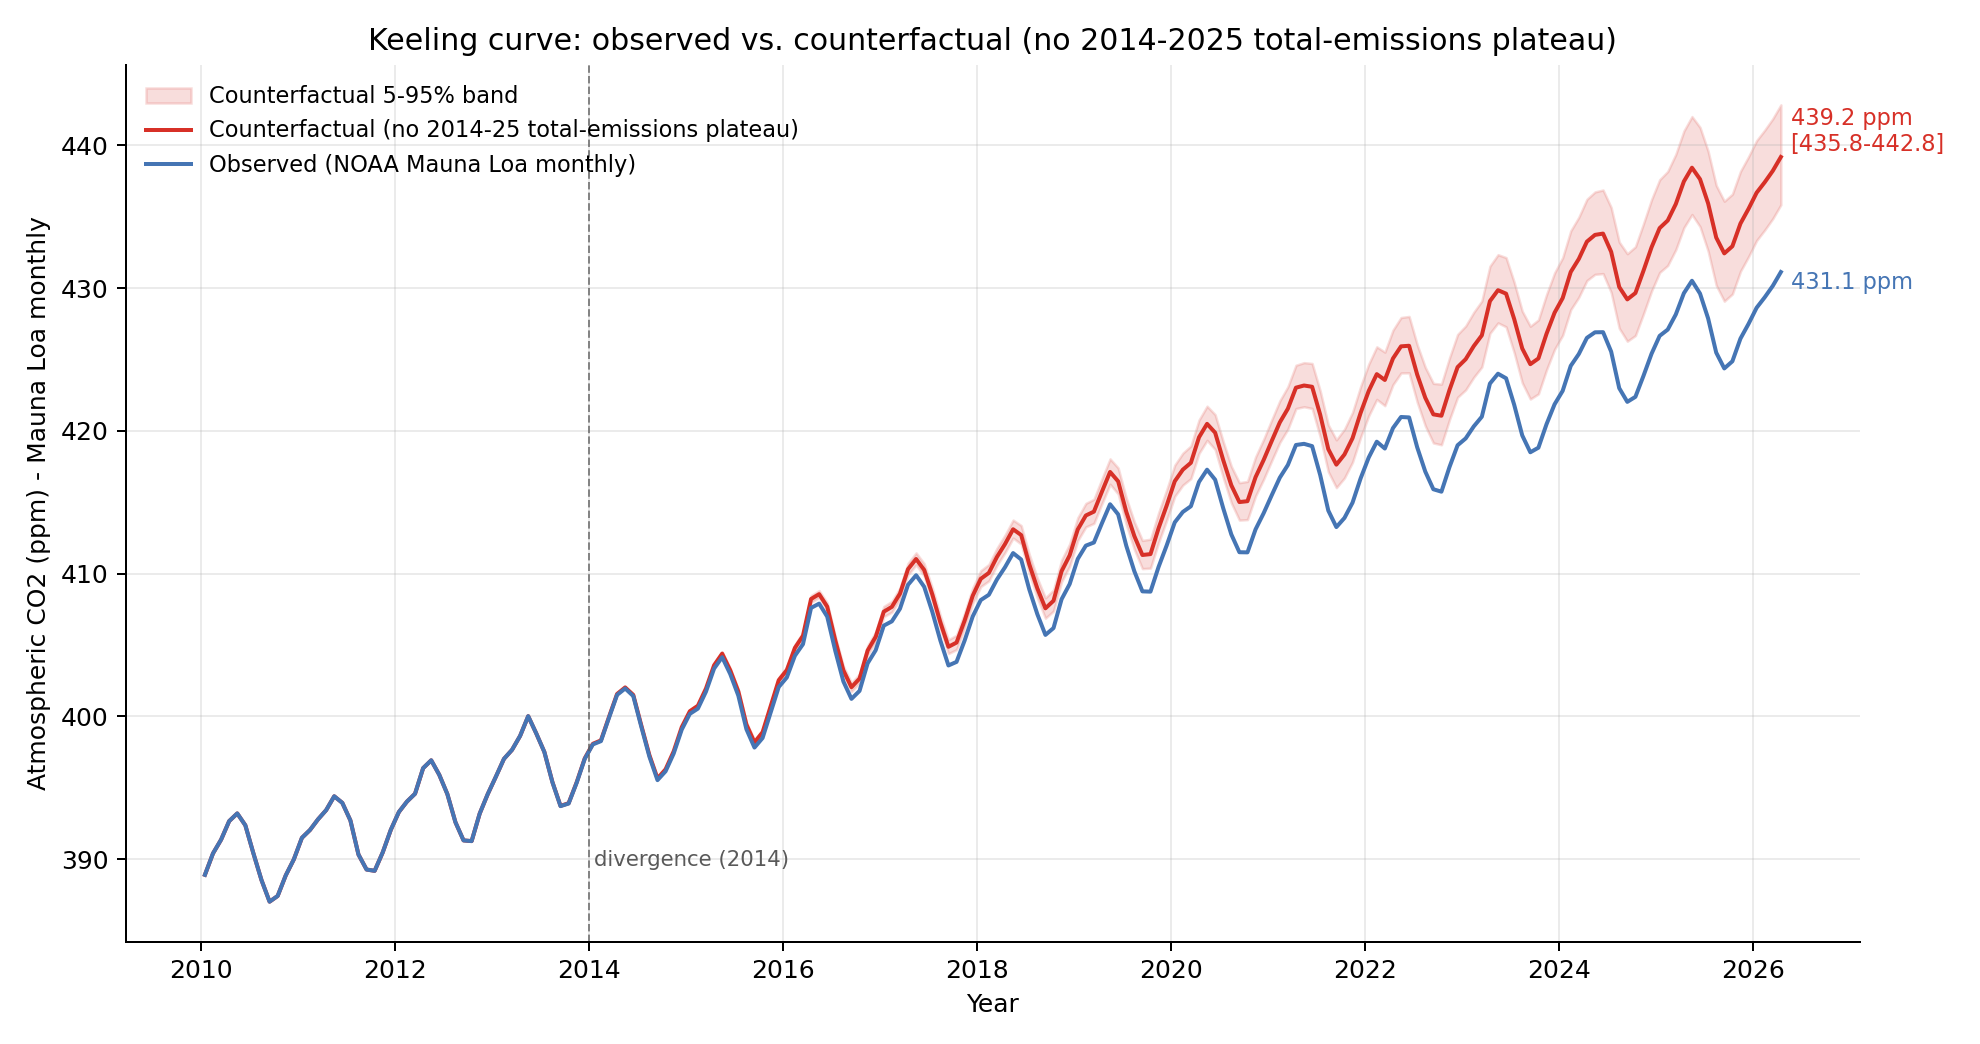
Finally, lets add in annual variability in atmospheric CO2, both observed (blue line) and modeled (red line).
We can also extend this all the way back to the start of the record. As expected, a plateauing of global CO2 emissions transitioned us from an accelerated growth rate to a more linear growth rate. Its not a dramatic swing – global CO2 emissions remain at above 40 billion tons per year! – but its at least some detectable progress away from a much worse emissions future.
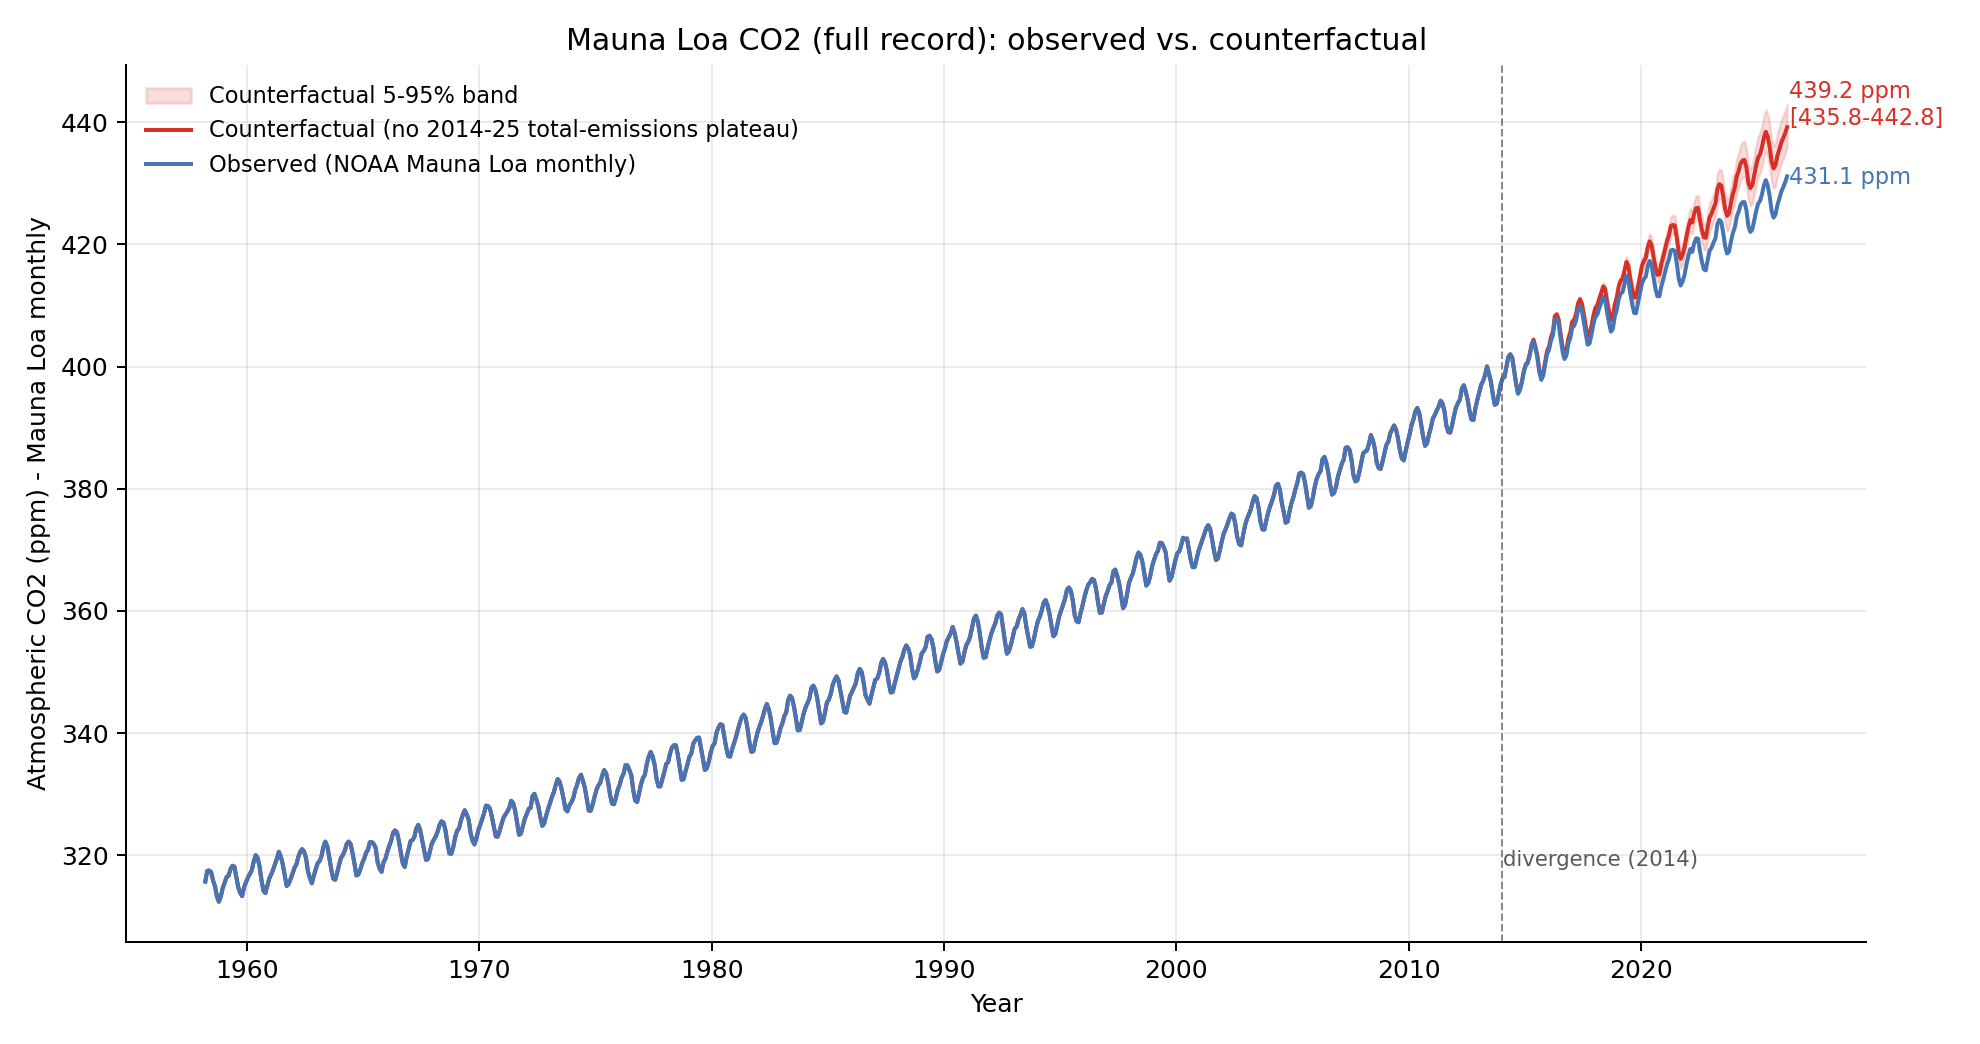
What are the takeaways here? Atmospheric CO2 concentrations are still climbing despite some success in flattening global emissions. But this is generally what we’d expect; if emissions had continued to increase concentrations would be noticeably higher and accelerating rather than exhibiting a more linear increase. Observed increases in atmospheric CO2 are, if anything, a bit on the low end (though still in the uncertainty range) of what the model expects based on observed emissions.1 I’ve included a more detailed writeup and code to reproduce this analysis on my GitHub here.
So next time someone shows you a graph of CO2 concentrations and argues that nothing is changing, you can show them how much worse it would have been had we really done nothing to change our emissions trajectory.
Update
I got a number of questions from folks about the role of slower growth in fossil emissions vs falling land use emissions in driving these changes. It turns out that around 78% of the avoided increase in atmospheric CO2 is attributable to fossil emissions, and 22% to land use. The GitHub repo has more details on this sensitivity test.
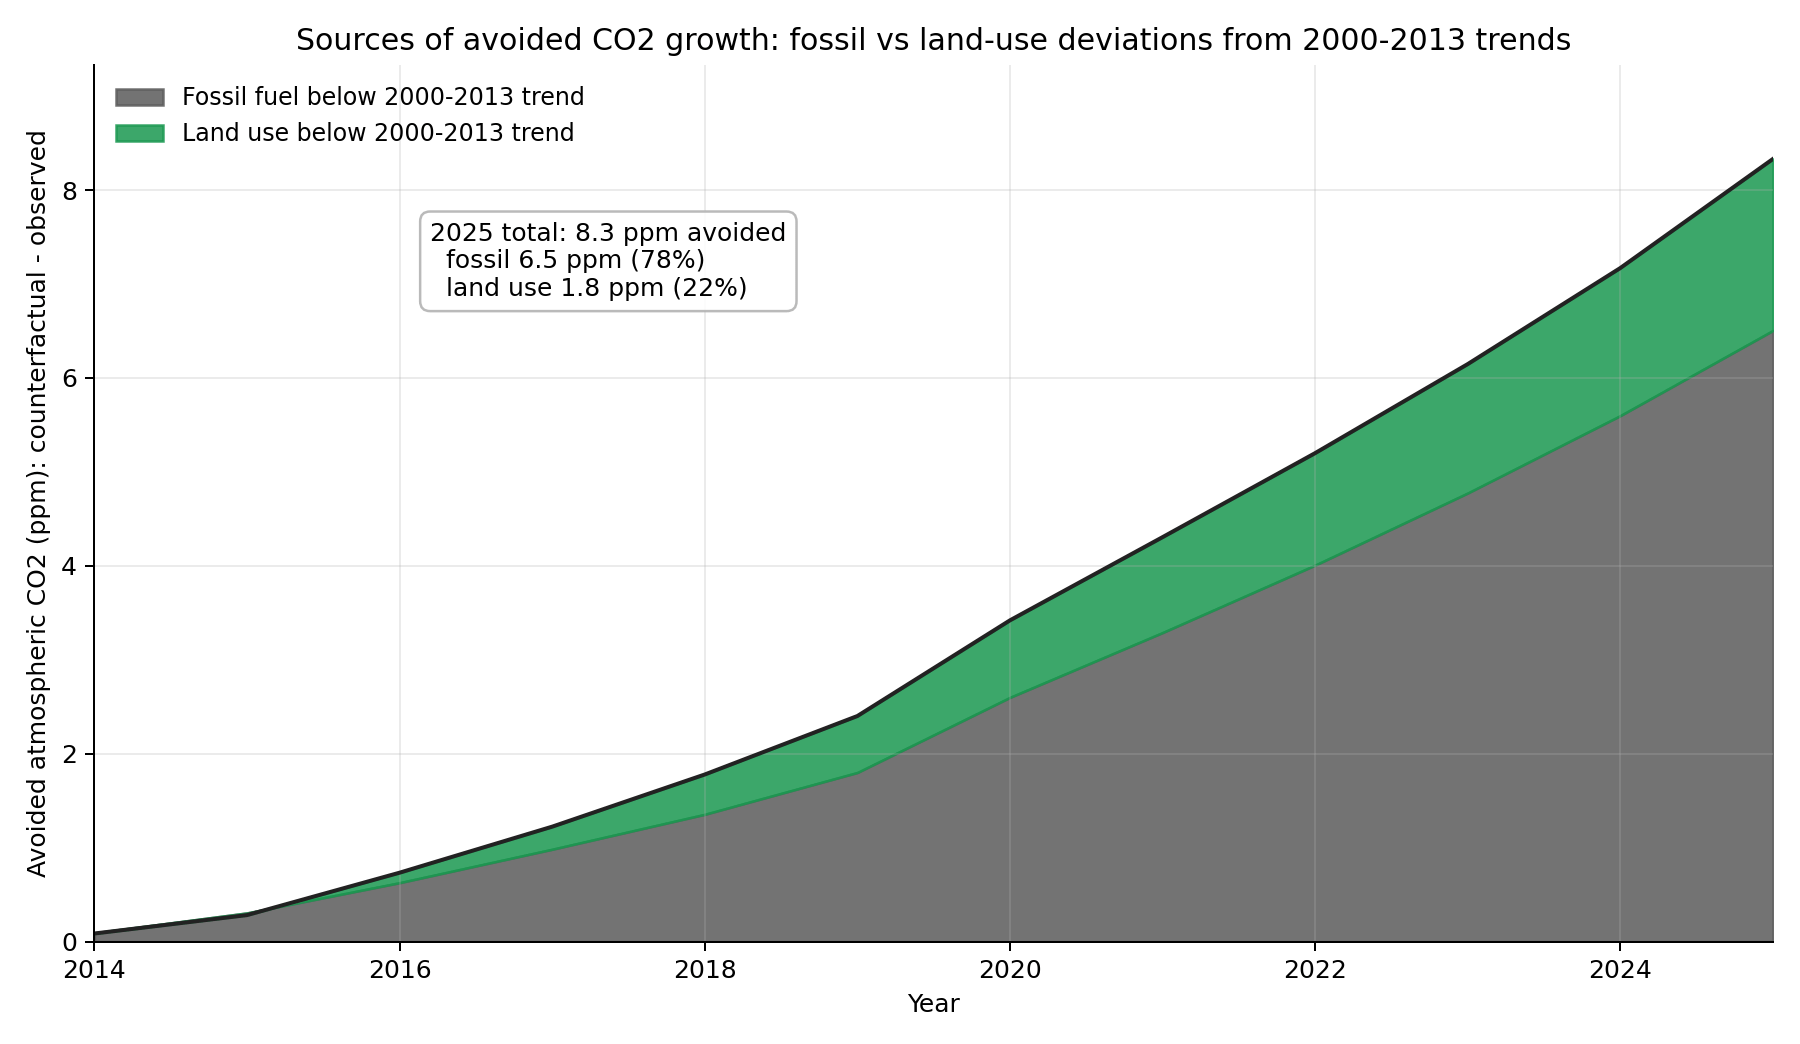
This suggests that it is our emissions, not recent changes in carbon cycle feedbacks, that are the main driver of growth in atmospheric concentrations. That being said, we still expect some weakening of carbon sinks in a warmer world – something we have started to see in the data.
I'd be interested in seeing how these plots change over time if you take into account the weakening land and ocean carbon sinks (some of which are being transformed into sources), as well as the increasing contributions to atmospheric CO2 and CH4 concentrations from thawing permafrost.
Thank you for this. While I knew that emissions growth had slowed, I didn’t realize the extent to which emissions had plateaued, so that’s welcome news.