
On the death of RCP8.5
We should celebrate progress, but not overstate it


With the release of the new van Vuuren et al 2026 paper on the emissions scenarios that will be used in the upcoming IPCC 7th Assessment Report, the internet has been abuzz with debate over the implications of the formal retirement of the RCP8.5/SSP5-8.5 scenario. The president of the United States even weighed in over the weekend in his own unique style, posting that “the United Nations TOP Climate Committee just admitted that its own projections (RCP8.5) were WRONG! WRONG! WRONG!”.
van Vuuren et al justify this move by noting that “the CMIP6 high emission levels (quantified by SSP5-8.5) have become implausible, based on trends in the costs of renewables, the emergence of climate policy and recent emission trends,” citing the paper that we published in Nature back in 2020.
Others have pointed out that RCP8.5 was never particularly plausible, and have criticized claims that the move away from using these scenarios reflects actual progress on reducing emissions.
So what actually happened here? It turns out that two things can be true at the same time:
RCP8.5 (and its successor SSP5-8.5) were designed to be a worst case emissions scenario, not the most likely outcome even in a world that did nothing to address climate change. We were probably never headed to a tripling of global emissions by 2100 (to say nothing of a five-fold increase in coal use), even in the absence of climate policy.
Rapid declines in clean energy costs have bent the curve of future emissions downward, with new scenarios designed to reflect current policies notably lower than most baseline scenarios in the literature. The 21st century is now unlikely to see a continued expansion of fossil fuel use globally, with current policy scenarios reflecting relatively flat global emissions going forward.
Beyond business as usual
Emissions scenarios can broadly be categorized as “baseline” scenarios or “mitigation” scenarios. Baselines represent worlds where there are no additional efforts to address climate change (or in some cases turn back the clock to some earlier period and assume no policy after that point), while mitigation scenarios explore concerted efforts to reduce global emissions.
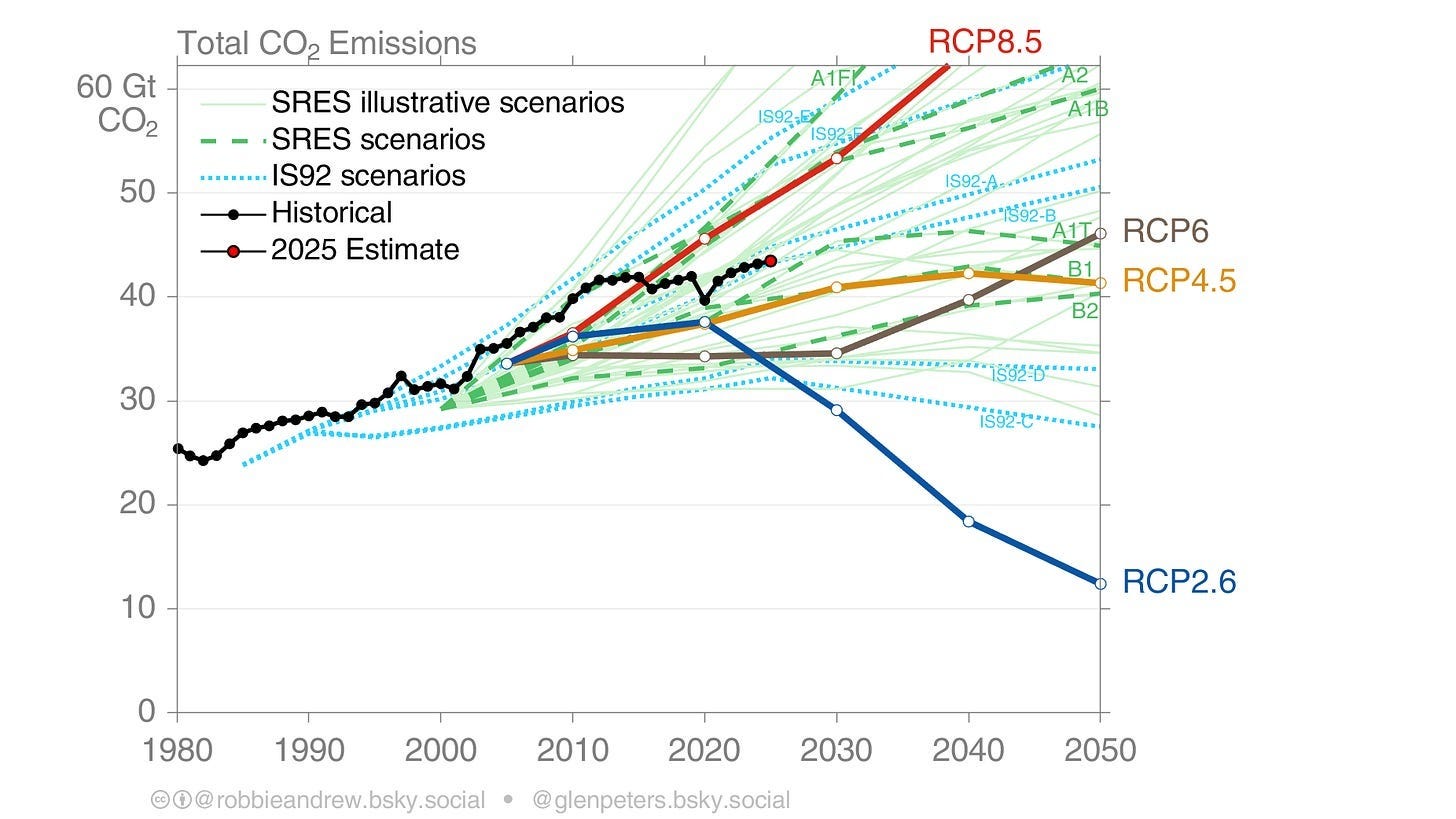
When RCP8.5 was first published global emissions were skyrocketing, having increased 30% in just the past decade. Clean energy sources were quite expensive, electric vehicles largely non-existent, and the idea that we would continue to increase our use of coal, oil, and gas through the end of the century was not seen as far-fetched.
Even in that context, RCP8.5 was chosen to represent the high end of the baseline scenario range available to the researchers at the time – around the 90th percentile. It was never a likely outcome even in a world that did not address climate change; rather it was always intended to represent a worst case scenario that pushed fossil fuel expansion to the max.
There are many other baseline scenarios with lower emissions, which were equally plausible as RCP8.5, even in the absence of climate policy. The original article that published the baselines, shows total CO2 emissions can be as low as RCP4.5 depending on the socioeconomic assumptions and the model used.
However, in part due to a breakdown in communication between the energy modeling community that develops the scenarios and the climate science community that uses them, RCP8.5 came to be incorrectly portrayed by many as the most likely “business as usual” scenario.
Around a decade ago the scenario started to garner more criticism. Justin Ritchie and Hadi Dowlatabadi published a paper in 2017 questioning whether the extremely high use of coal in RCP8.5 – which envisioned things like turning coal to oil for vehicles when oil reserves ran dry later in the century – was even possible given the world’s recoverable coal reserves. Ritchie and I (Zeke) wrote in 2019 that a 3C world was now “business as usual”, reflecting that:
Our business-as-usual projection of 3C of warming – rather than 4 or 5C – is a testament to the progress in global decarbonization over the last few decades. It also reflects the fact that rapid growth in coal use during the 2000s was not necessarily characteristic of longer-term energy use trends. The world has taken concrete steps to move away from coal in the past decade, and this progress should be reflected in our assessment of likely emissions pathways – and their resulting climate impacts – going forward.
In 2020 we published our Nature piece, arguing that we should “stop using the worst-case scenario for climate warming as the most likely outcome”, and that outcomes like RCP8.5 had become increasingly implausible with every passing year as clean energy costs fell and coal use plateaued.
Identifying real progress
So if we were likely never heading for a world of RCP8.5, with its tripling of global CO2 emissions by 2100 (and five-fold increase in coal use), where were we actually headed? How much has the energy transition to-date (which has grown to over $2 trillion annual global spending) actually changed our future trajectories?
This is an impossible question to precisely answer given that it relies on an inherently unknowable counterfactual scenario. It is not correct to state or assume that RCP8.5 was the baseline; we simply do not know the baseline and can only estimate it. But one way to approach the question is to look at where the scenario literature thought we were headed – what the actual range of baseline scenarios were.
The figure below show the CO2 emissions between 2000 and 2100 in the old RCP8.5 scenario, the full range of baseline scenarios published in the IPCC AR6 WG3 scenario database,1 and the new CMIP7 medium illustrative scenario published by van Vuuren et al 2026.2
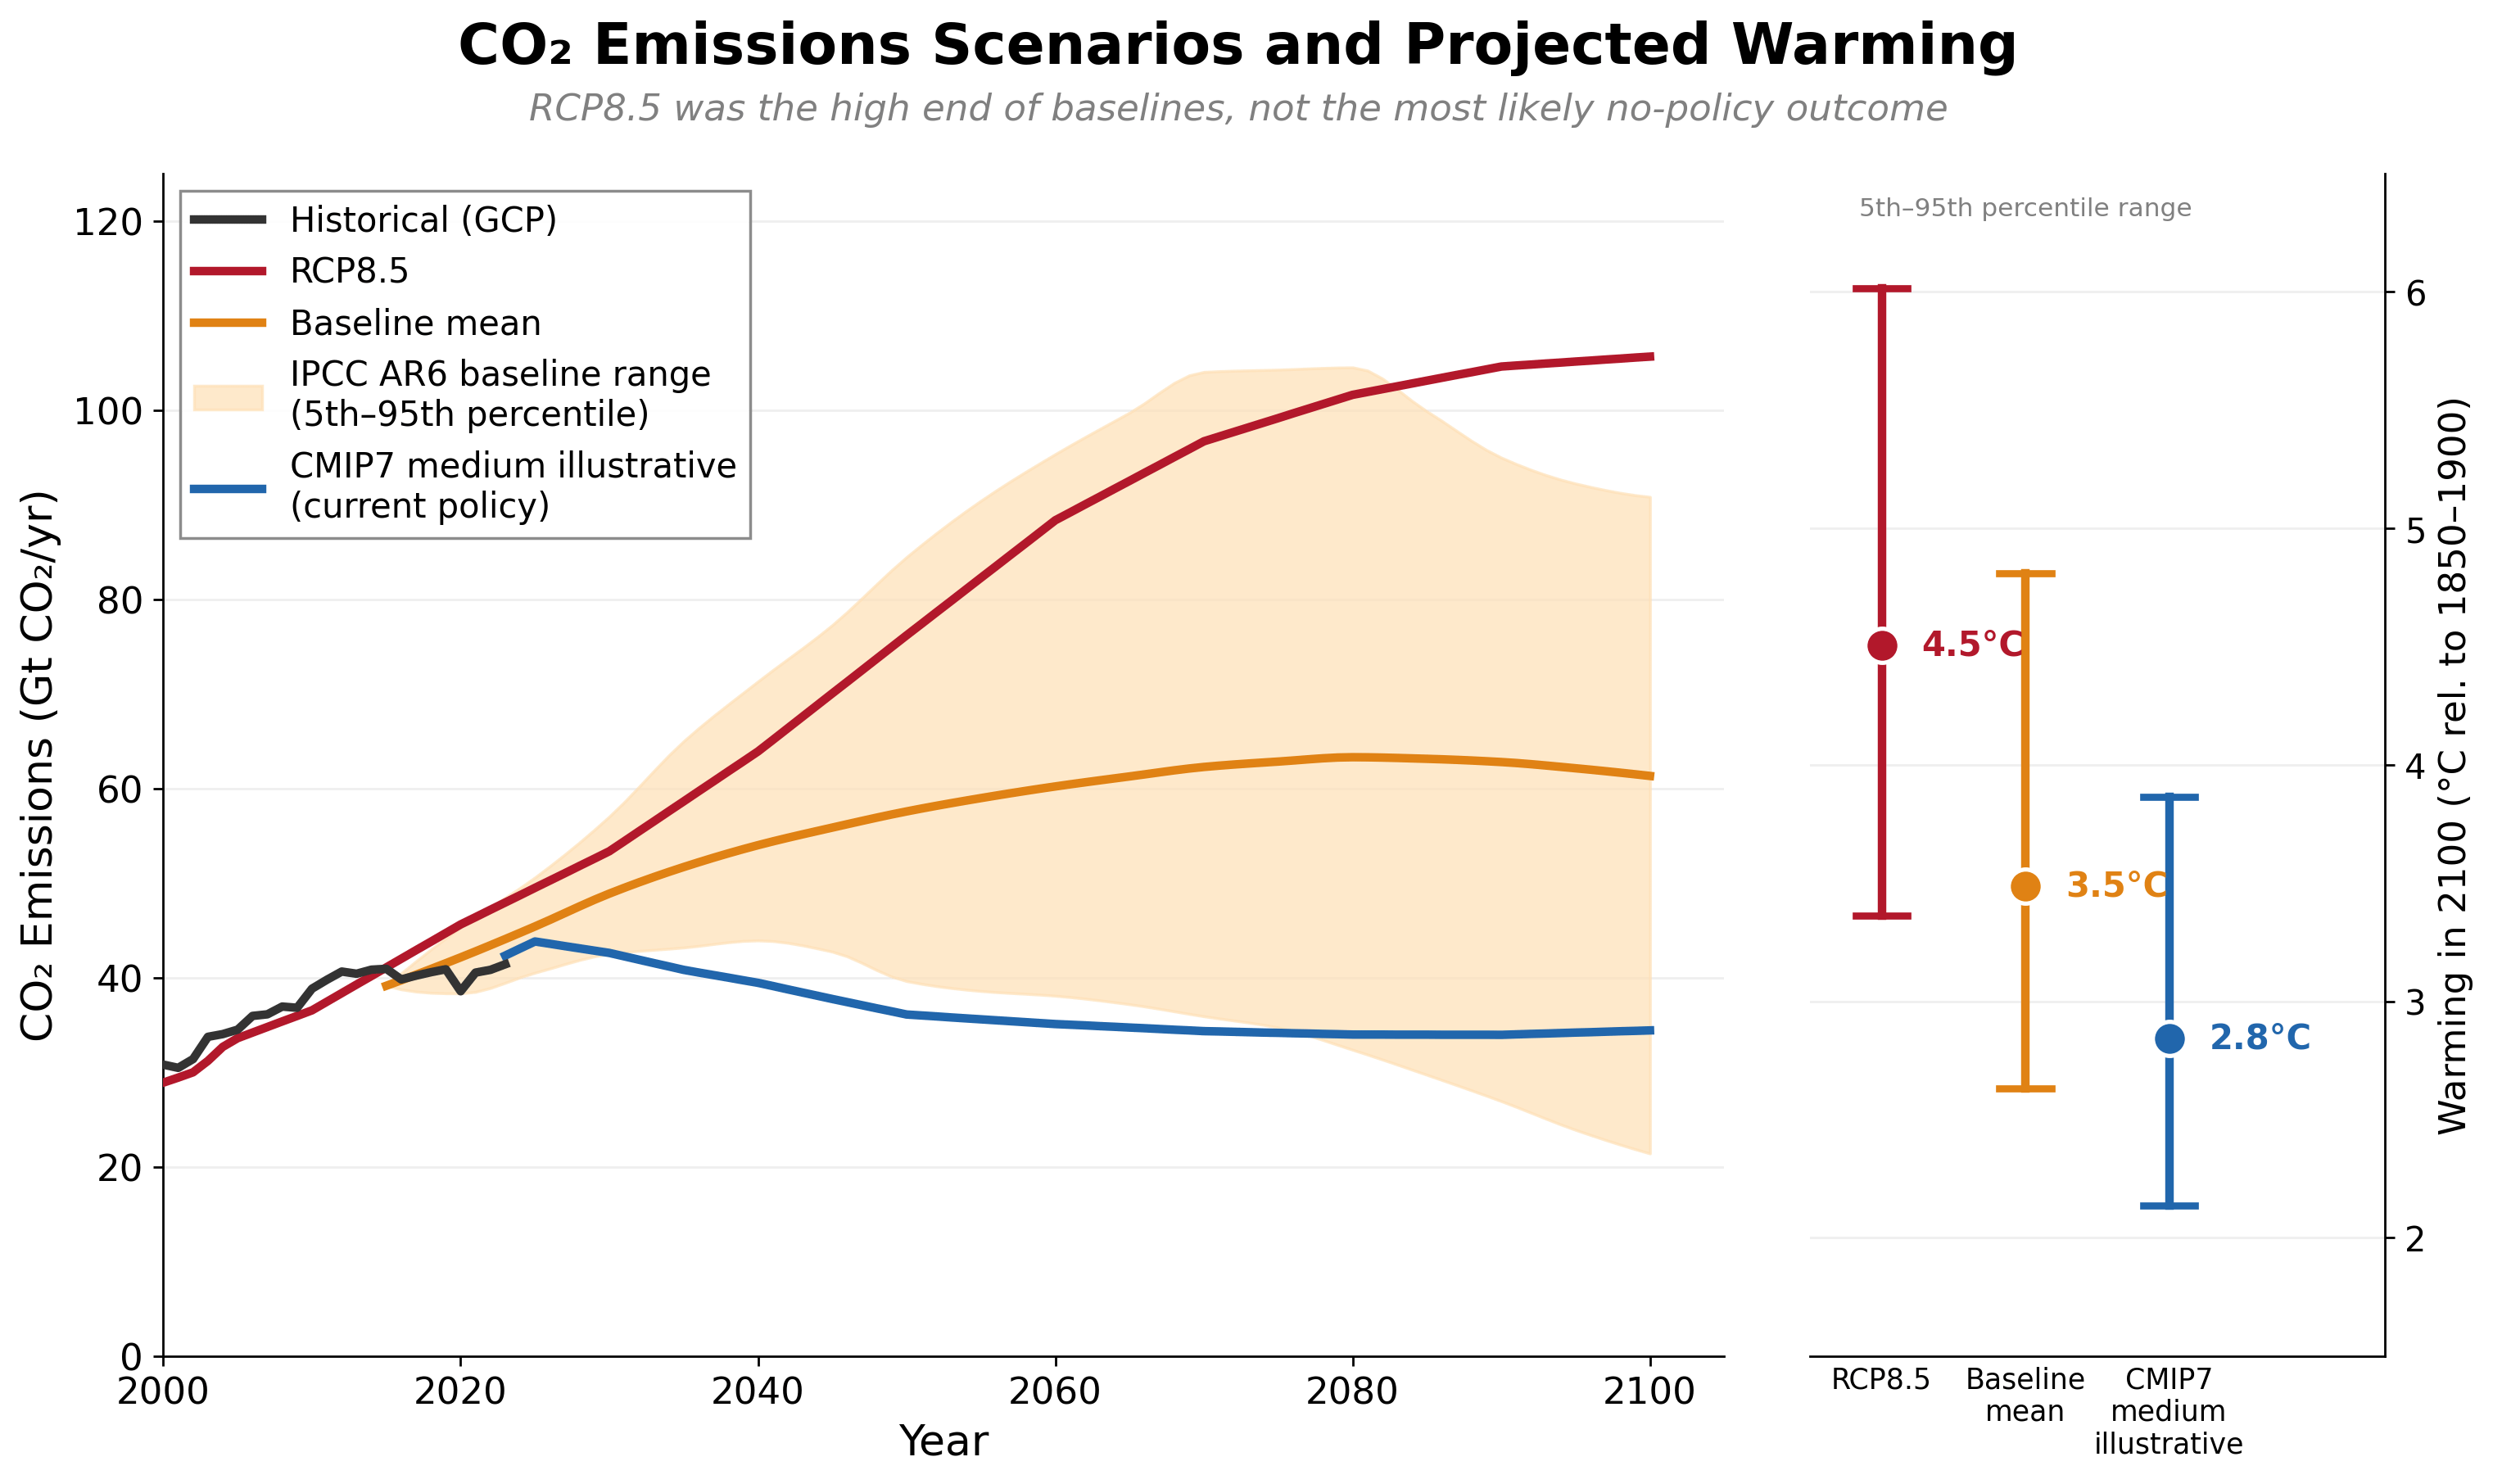
We don’t actually know where in the baseline range (or outside of it!) we might have been heading in this counterfactual world. But the average of the baseline range – with its approximately 3.5C warming by 2100 – is a much more justifiable counterfactual than the high-end RCP8.5 baseline. This suggests that progress on policy and technology has reduced expected 2100 warming by around 0.7C, rather than the full 1.7C difference between RCP8.5 and the new medium scenario. A plausible reduction of ~0.7C warming represents enormous progress and a large reduction in future damages, even as a 2.8C world under current policies remains far from acceptable.
The mid-range of the baseline scenarios back in the late 2010s when most of those scenarios were developed is roughly analogous with the CMIP7 high illustrative scenario today (~3.3C), which envisions a roll back of policies that have been enacted over the past decade as well as slower technological progress on clean energy going forward.
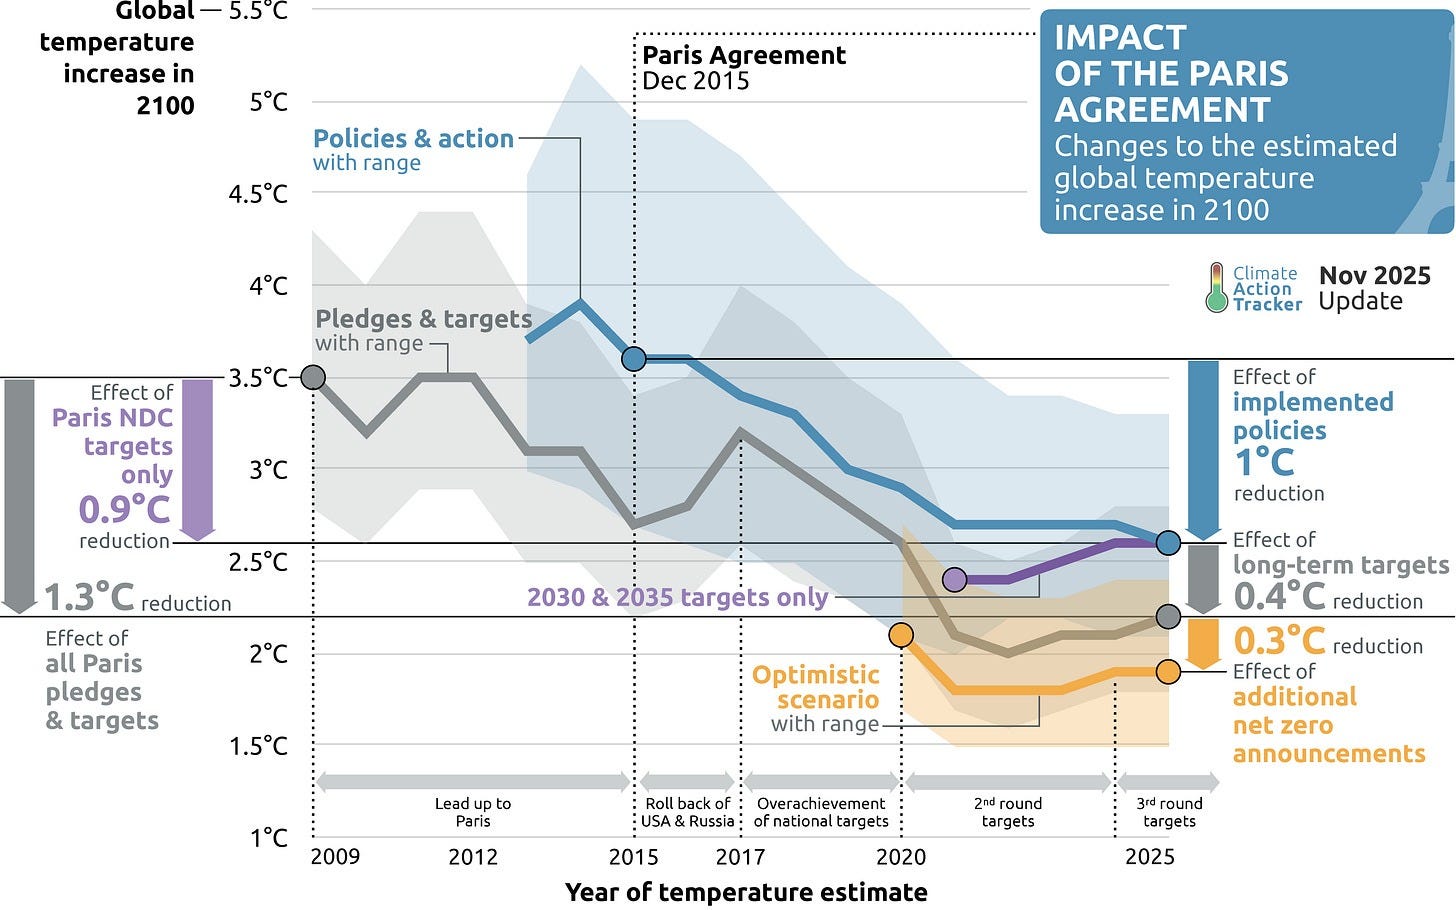
The mid-range baseline scenario warming is also consistent with baseline warming estimates published by both the IEA (3.5C) and Climate Action Tracker (3.6C) prior to the signing of the Paris Agreement. Climate Action Tracker has also tracked the changes in its “policies and action” scenario over time, which has declined from 3.6C in 2015 to 2.6C in 2026, finding a similar ~1C decline in expected future warming.
It is hard to gauge the “impact of the Paris Agreement” or any other specific climate policy intervention in isolation. In a world without Paris we would still likely have seen a reduction of future emissions projections associated with continued cost declines of clean energy technologies. Similarly, even if coal use did continue to grow, it is not at all obvious it would have grown at the scale and rate as in RCP8.5. But this does not mean that these declines are divorced from other policy decisions made by countries over the past few decades.
Technology is, after all, not exogenous; it does not arise solely from spontaneous innovations. Rather, it reflects an interplay between the government and the private sector over cycles of research and development, early stage deployment, and eventual economies of scale.
Let’s take the example of solar energy, which is covered in depth in Greg Nemet’s excellent book “How Solar Energy Became Cheap”. Here formative R&D work done by Bell Labs in the 1950s and by the US DOE in the 1970s helped develop and commercialize the technology, while subsidies in Germany and Japan helped drive down costs with larger scale deployments in the 1990s and 2000s. More recently, dramatic cost declines have been driven at least in part by enormous investments in both domestic and export markets by China.
High warming outcomes can still occur
When we try to estimate how much the world will warm this century and beyond, we run into three fundamental uncertainties: our future emissions, the sensitivity of the climate to increasing forcings, and the carbon cycle feedbacks that determine the portion of our emissions that remain in the atmosphere.
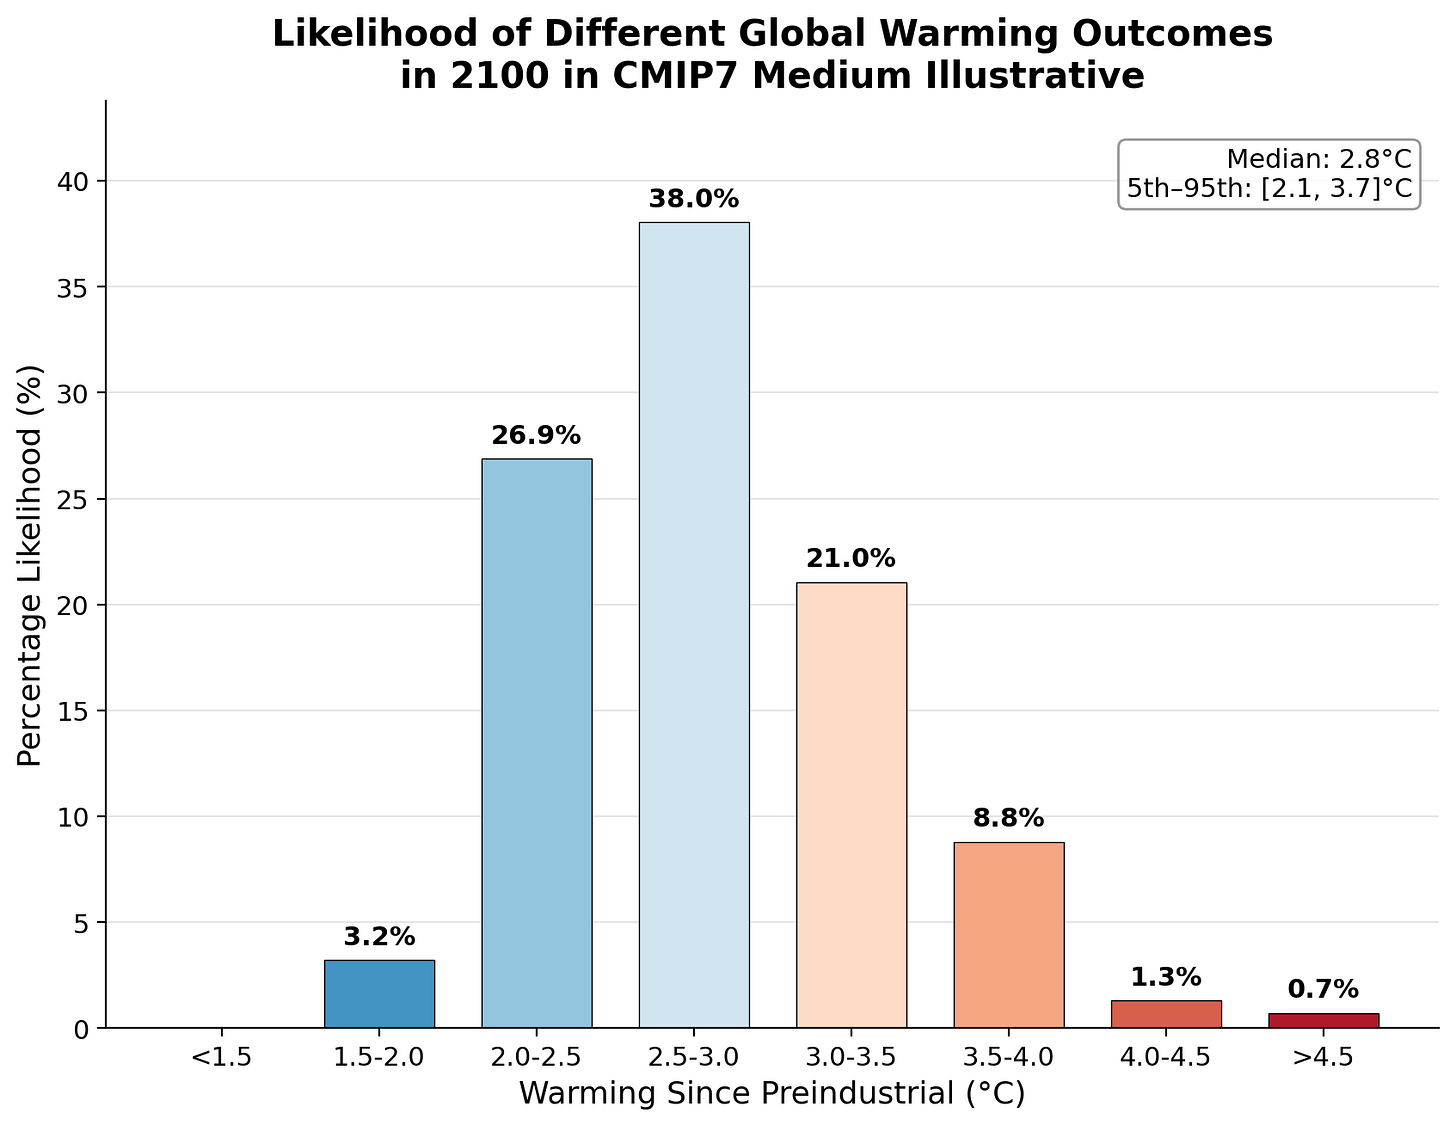
While we tend to give the central estimate of future warming in 2100 associated with a given emissions scenario (e.g. 2.8C), this single number hides a pretty wide range of actual possible climate responses. For example, the figure below shows probability of reaching different temperature outcomes under the CMIP7 medium illustrative scenario. While the median is 2.8C, the 5th to 95th percentiles span 2.1C to 3.7C, and there is even a small (~2%) chance of 4C or more warming.
The new medium scenario is designed to be in-line to current policy scenarios in the literature. But current policies represent neither a ceiling nor a floor on future emissions. Future emissions are in society’s hands. Indeed, it is ironic to see President Trump criticizing climate science for its past use of high emissions scenarios when his administration actively supports a roll back of existing climate policy, the restriction of new clean energy development, and mandating that coal plants remain operating despite their high costs.
The new CMIP7 scenarios include a “High” emissions scenario that explores a more Trumpian future where current policy is rolled back and clean energy deployment slows. The high illustrative scenario finds 2100 warming of closer to 3.3C (with a range of 2.5C to 4.4C).
It is important to emphasize that the world doesn’t end in 2100, even if many of our past emissions scenarios and climate model simulations did. One of the major advances in the IPCC AR7 is a plan to extend scenarios through 2150, since 2100 is not nearly as far away as it used to be.
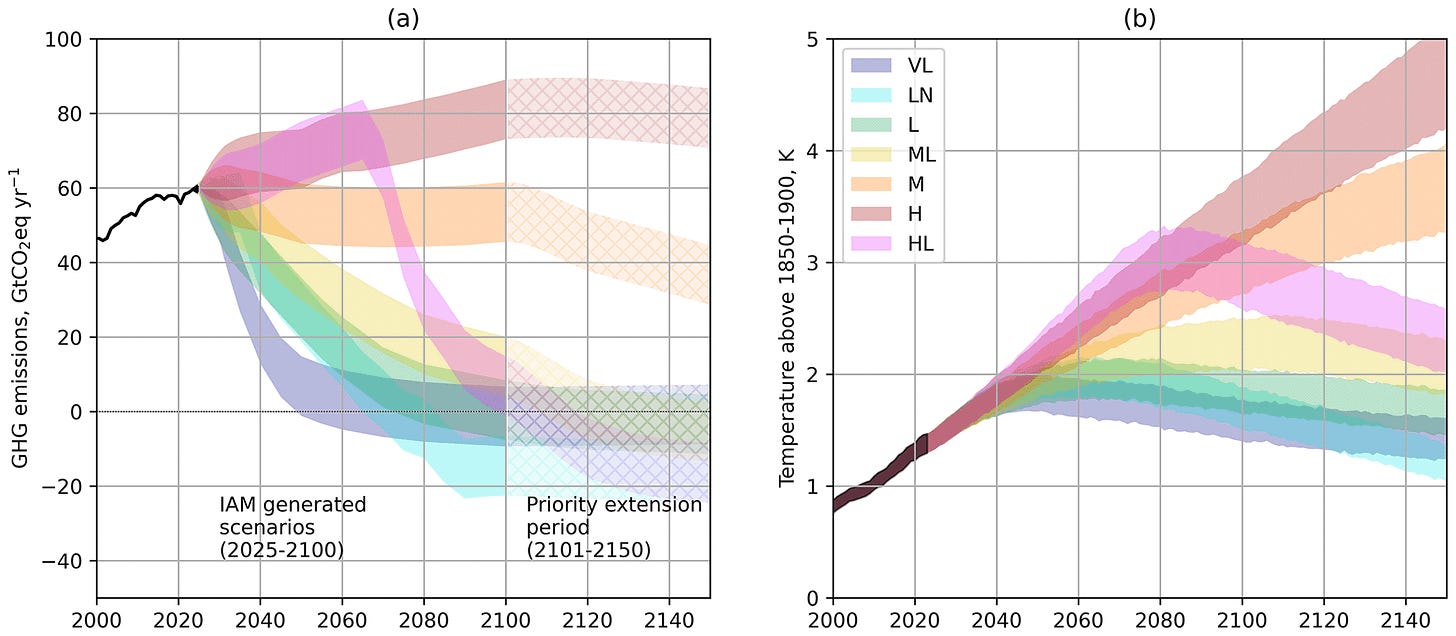
The brutal math of climate change is this: as long as CO2 emissions remain above zero, the world will continue to warm. The medium scenario ends up closer to 3.7C by 2150, while the high scenario ends up more or less matching the warming in the old RCP8.5 scenario despite an assumption of flattening or modestly declining emissions after 2100.
It is also wrong to say that the worst predictions of climate impacts this century can now be ruled out by this revision. High-end temperature projections for the end of the century are reduced compared to earlier IPCC assessments. Yet, the IPCC WGII report found that risks across the five “reasons for concern” it examines have all risen for a given level of global warming. So, even if the high-end emissions in RCP8.5 won’t materialize, the damages projected in these earlier climate simulations remain very much in play.
A tripling of global CO2 emissions by 2100 may never have been particularly plausible even back in 2011 when RCP8.5 was originally published. But a 21st century of increasing fossil fuel use leading to a doubling of emissions was within the realm of the possible. The fact that we are no longer heading toward that is a sign of progress, rather than somehow undermining the edifice of all of climate science as both President Trump and some overly excited internet pundits claim. And of course, we still have a long way to go to get emissions down to (net) zero and stabilize global temperatures.
After all, as we wrote back in 2020, “This admission does not make climate action less urgent. The need to limit warming to [well below 2C]3… does not depend on having a 5C counterpoint.”
This will likely slightly underestimate emissions in baseline scenarios when the RCPs were published in 2011, as the WG3 scenario database was published in 2022 (though many of the scenarios were run much earlier, with the SSP baselines dating back to before 2017) and at least some clean energy cost declines since 2011 are baked in.
Note that these are illustrative placeholder scenarios; the final CMIP7 emissions scenarios will be published in September 2026 (and we will have much more discussion of them then!). That being said, van Vuuren et al are clear in the paper that “the final emission trajectories will depend on the finalized IAM runs but are expected to be roughly consistent with the illustrations provided here.”
We had originally said “limit warming to 1.5C”, but that ship has unfortunately sailed. In addition to lowering the high emissions scenarios, the new van Vuuren et al paper also more or less eliminates scenarios that keep warming to 1.5C without overshoot and subsequent drawdown.
 | A guest post by
|
 | A guest post by
|
We interviewed van Vuuren about this last week: https://youtube.com/live/MYWokv0Byas
He said we can still see RCP8.5 implied temperatures even without RCP8.5 emissions.
RCP8.5 is an *emissions* scenario which is then translated to GHG concentrations, then to forcings, then to temperature. While we may not be on the worst case RCP8.5 emissions scenario, we are currently tracking the worst case RCP8.5 implied *forcing*.
Also note that there is a tremendous amount of assumed CDR in the translation from emissions to temperature. You can see it in the graphs that show negative emissions. But even those without below zero emissions assume a lot of CDR!
If Hansen is correct that ECS=4.5ºC, then even lower actual emissions can lead to RCP8.5 implied temperatures. We are currently on track for +2ºC warming in the 2030s and +3ºC in the 2050s/60s.
It's nice that we are not on track for RCP8.5 emissions. But we are on track for +3ºC or more warming and that is utterly catastrophic! We need to start taking climate action seriously.
Good stuff overall! But a few big issues
1. RCP8.5 was not designed as a "worst case" scenario.
It was the highest of the RCP set, and the only baseline.
But that by itself does not mean "worst case."
RCP8.5 comes from the MESSAGE family and originated in A2r (Riahi 2007) and A2 (SRES).
Of A2 SRES was explicit: "A2 is far from an environmental "worst case" scenario, even if it generally has the highest GHG emissions."
So maybe another communication failure.
2. You treat the AR6 baseline range as an accurate forecast distribution and then use that distribution to evaluate the effects of climate policy.
That range is contaminated by the return-to-coal hypothesis, flawed GDP assumptions, and erroneous population projections We dive into this here: https://iopscience.iop.org/article/10.1088/1748-9326/abcdd2
And updated here for AR6:
https://www.pnas.org/doi/full/10.1073/pnas.2214347119
We conditioned the AR5 scenarios on consistency with recent trends and near term projections and arrived at a subset of plausible scenarios that project 2.2C (at the center) for 2100 https://iopscience.iop.org/article/10.1088/1748-9326/ac4ebf
So in your exercise, you might have used that subset of scenarios rather than the full AR6 range, which we know is full of implausible scenarios
So to answer the question, what effect has climate policy had?
We should not rely on scenarios as forecasts
Instead, we should rely on traditional methods of policy evaluation
So far, global decarbonization has not accelerated, as would be necessary for climate (mitigation) policy to have had a discernible effect to date
Figure here: https://rogerpielkejr.substack.com/p/understanding-decarbonization
For climate policy to have an effect, we would have to see an inflection point in the curve at some point in the future
Climate policy may indeed be responsible for maintaining this rate of decline (and probably is)