
How the DOE and EPA used and misused my research
Elevating contrarian views while burying the actual science

I’ve been traveling with my family on vacation in Iceland for the past week, so the timing of recent events has been less than ideal. Given that I am cited in both the recent DOE report and EPA proposed rule, I thought it would be useful to address how my work was used and misused in more detail. Expect more on the broader topics covered in the report in coming weeks.
Moving away from current policy
In their proposed rule titled “Reconsideration of 2009 Endangerment Finding and Greenhouse Gas Vehicle Standards”, the EPA cites my work (among others) to argue that the original 2009 endangerment finding was too pessimistic. Specifically, they say that:
With respect to projected increases in GHG concentrations and global temperatures, the projections relied upon in the Endangerment Finding appear unduly pessimistic in light of empirical observations made after it was finalized in 2009 through 2024. The Endangerment Finding relied primarily on IPCC AR4 to predict global temperature increases between 1.8 and 4 degrees Celsius by 2100, an extremely wide and variable range that necessarily impacts the existence, extent, and severity of anticipated dangers to public health and welfare. However, as previously noted, IPCC scenarios depicting worst-case, “business as usual” assessments have been criticized as misleading (2025 CWG Draft Report; Hausfather and Peters, 2020; Burgess et al., 2021; Pielke and Ritchie, 2020), and empirical data suggest that actual GHG emission concentration increase and corresponding warming trends through 2025 have tracked the IPCC’s more optimistic scenarios.
When I initially read this, I assumed that the range of 1.8C and 4C referred to in the document referred to warming since preindustrial, as is the convention for such numbers today. However, it cites the EPA 2009 endangerment finding, which itself references warming relative to a more recent 1990 baseline rather than 2100 (as Roger Pielke Jr rather assertively pointed out).
Warming between the preindustrial baseline of 1850-1900 and 1990 was approximately 0.7C, which would make the EPA’s range approximately equal to 2.5C to 4.7C. The high end of the EPA’s range thus approximately tracks the median warming in the SSP5-8.5 scenario in 2100.
In our 2020 Nature paper critiquing the use of worst case emissions scenarios like RCP8.5/SSP5-8.5 as the most likely outcome, we said:
Finally, we suggest that climate-impact studies using models developed for AR6 should include scenarios that reflect more-plausible outcomes, such as SSP2-4.5, SSP4-6.0 and SSP3-7.0. When RCP8.5 or its successor SSP5-8.5 are deployed, they should be clearly labelled as unlikely worst cases rather than as business as usual.
More recently, I’ve suggested that SSP2-4.5 is the scenario most consistent with current policy trajectories (Hausfather 2024).
But emissions scenarios only tell us part of the story. For any given emissions scenario – such as SSP2-4.5 – there is a wide range of possible climate outcomes driven by uncertainties in both the sensitivity of the climate to our emissions due to feedbacks like cloud changes, albedo changes, water vapor, etc. (climate sensitivity) and sensitivity of biosphere and ocean carbon sinks to our emissions and their associated warming (carbon cycle feedbacks).
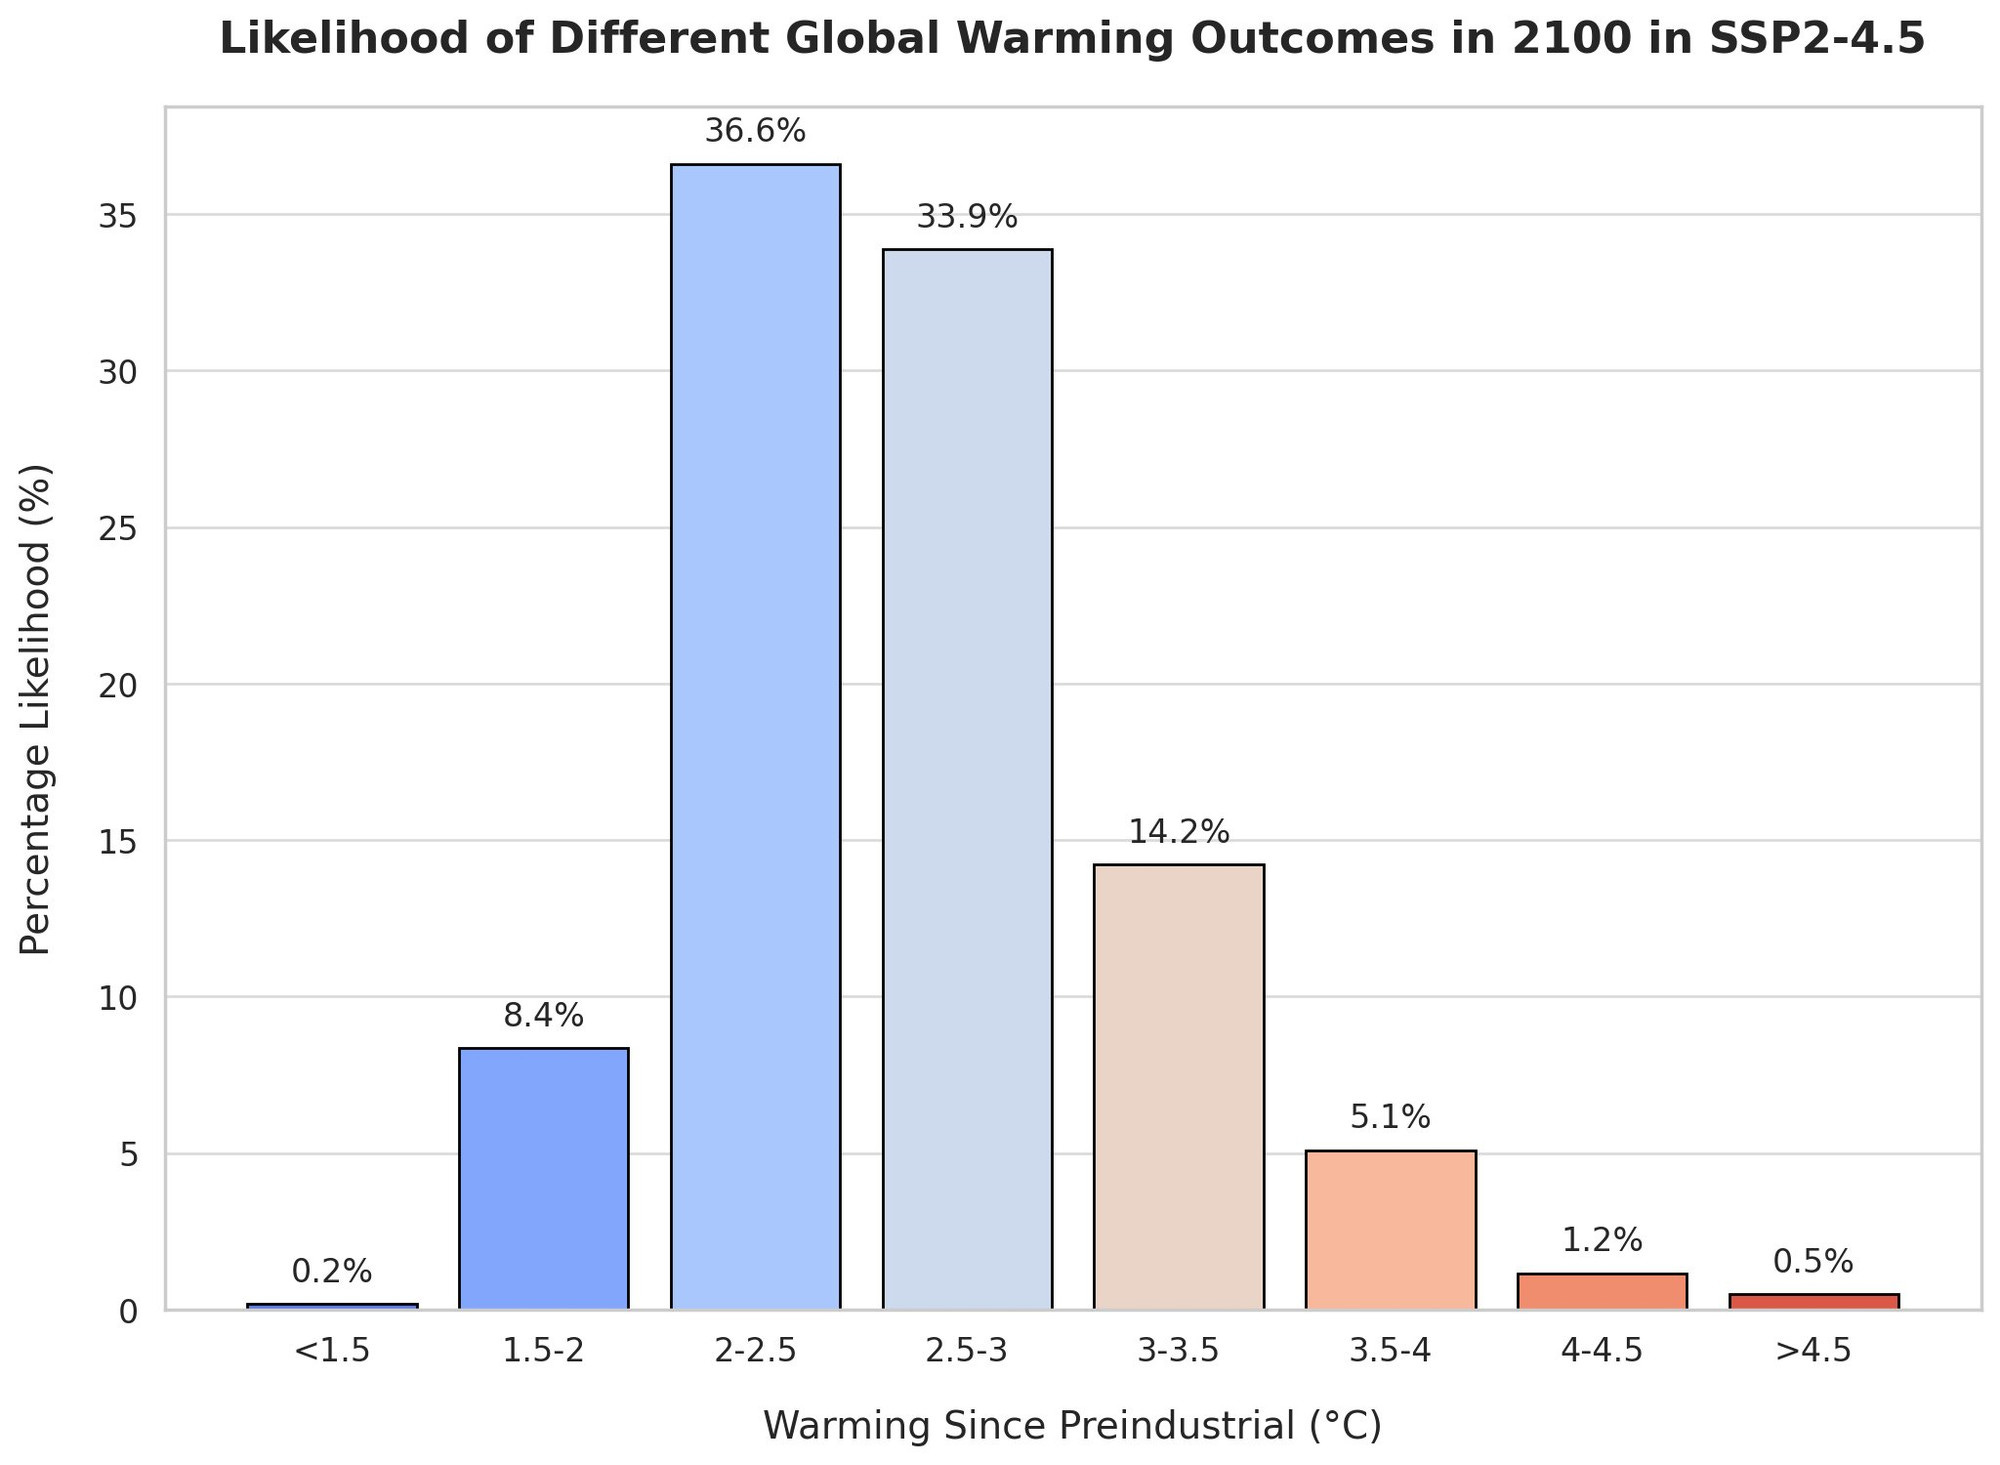
The figure below shows the likelihood of different 2100 global warming outcomes (relative to preindustrial), based on a climate model emulator tuned to the range of climate sensitivity and carbon cycle feedbacks in the recent IPCC AR6 report. While we cannot rule out warming approaching 4C by 2100 under this scenario, it is very unlikely (<0.5%) that we experience warming exceeding 4.5C under this emissions scenario.
But its instructive to take a look at what this emissions scenario actually entails. The figure below shows the annual CO2 emissions in the three emissions scenarios we identified as “more plausible” outcomes in our Nature piece: SSP2-4.5, SSP4-6.0, and SSP3-7.0.

It is increasingly clear that an emissions scenario like SSP3 is unlikely; emissions have plateaued over the past decade rather than continuing to rise, and the falling cost of clean energy worldwide makes a 21st century dominated by coal (which SSP3 foresees) pretty implausible.
At the same time, we should not take for granted that the world will “spontaneously decarbonize” and cut emissions by 75% by 2100 as we see in SSP2-4.5. When we refer to SSP2-4.5 as a current policy scenario, we mean just that – that its consistent with policies put in place by countries to drive deep decarbonization, as well as continued declines in clean energy costs over the 21st century. SSP2-4.5 is not a baseline scenario where the world takes no climate action or does not care about climate change (and, for that matter, neither is SSP4-6.0 with its ~40% cut in emissions by 2100).
To use current policy scenarios in order to justify the repeal of current policies (as the EPA is attempting to do) rests on a fundamentally flawed premise. If the world actively repeals climate policies – which the US proposes doing – it would potentially push us to a higher emissions scenario. Indeed, the high end uncertainty of a SSP4-6.0 scenario – which still involves large CO2 emissions reductions by 2100 – would be quite close to the upper end of the EPA’s 2009 range.
Similarly, the fact that the world has made some progress in bending down the curve of future emissions should not be used as a justification that climate change is not a problem. As we also noted in our Nature piece:
This admission does not make climate action less urgent. The need to limit warming to 1.5C, as made clear in the IPCC’s 2018 special report, does not depend on having a 5C counterpoint.
The performance of climate models
The DOE’s “A Critical Review of Impacts of Greenhouse Gas Emissions on the U.S. Climate” has an interesting take on my 2019 paper on the performance of old climate models (Hausfather et al., 2019). As readers of The Climate Brink may be aware, that paper evaluated the performance of old climate models in the years after they were published and found that old models had done quite well; 10 of the 17 models evaluated were more or less spot on with the rate of future warming (within its uncertainty range), while this increased to 14 of 17 models when accounting for mismatches between projected and observed forcings (as even a physically perfect model would be off if it misforecast human emissions of CO2 and other greenhouse gases).
However, rather than actually citing anything directly in my paper (or any of its conclusions), the authors pulled out a rather obscure figure in my supplementary materials (Figure S4) to claim that “observed atmospheric CO2 concentrations tracked the low end of the SRES range and also of subsequent IPCC scenario ranges”.

First of all, their quoted text is incorrect, as this figure does not show CO2 concentrations compared to the 2000 SRES scenarios (indeed, all models that disagree with observed CO2 concentrations well predate the SRES scenarios). The figure they would actually want to use is this one by Glen Peters, which in fact shows historical emissions more or less in the middle of the SRES range: above B1, B2, and A1T but below A1F1, A2, and A1B.

More problematically, however, their use of my Figure S4 ignored the rather more prominent Figure 1 in my paper that showed the total model forcings compared to observationally-informed forcings. If anything, older models tended to have too-low rather than too-high forcings, as most of the ones published before the mid-1980s only included CO2 and did not model future increases in other GHGs like CH4, N2O, or halocarbons.

Of course, the even bigger problem is that they scoured my paper on the performance of climate models to find the one figure (deep in the supplementary materials) to reinforce the point they were trying to make, and never actually referred to the broader conclusion of the paper that old models had by-and-large performed quite well. This is indicative of a deeper problem in the DOE report: it cherrypicks figures and parts of studies to support a preconceived narrative that minimizes the risk of climate change. In this case, the actual content of my paper went counter to the narrative they were trying to present, and thus was ignored.
As Andrew Dessler has noted this is a strategy common in the legal field where the goal is to make a case for one point of view, but more foreign in the science where the search for the truth (wherever it may lie) is the driving motivation.
Deep-sixing the US national climate assessment
But the most egregious part of this whole process is the promotion of one-sided views by a small number of contrarian researchers while simultaneously suppressing the actual congressionally-mandated National Climate Assessment (NCA). The 5th NCA, which I helped author, was a process involving hundreds of scientists over three years. It went through many rounds of public reviews, agency reviews, and a review by the National Academy of Sciences. It was signed off on by 13 different federal agencies – as was the 4th NCA that was released during the first Trump administration.
All NCAs are now gone from government websites. If you go to the website of any of the NCAs you get a “This site can’t be reached” error. Indeed, the DOE’s report is strewn with dead links to the now-unavailable NCA reports.
Thats why I’ve publically called this process a farce. It would be one thing to undertake Steve Koonin’s original proposal of a “red team / blue team” exercise that he pushed for in the first Trump administration. That would give undue weight to somewhat fringe views compared to the broader scientific literature, but it would at least provide a set of counterarguments.
But providing only the red team (and a very rushed red team document written in two months with only five authors at that) while actively removing the official US National Climate Assessment shows what this actually is: a politically motivated pretext to overturn the EPA’s endangerment finding that CO2 is a pollutant, not an actual search for the truth.
There will be more on both the EPA proposed rule and the DOE’s report in the coming weeks; it takes time to assemble a group of experts broad enough to address the veritable Gish Gallop of claims in the 151-page DOE report (and the 302 page EPA proposed rule). But the broader climate science community is working on a number of efforts to provide a rebuttals.
Nice post, Zeke. The report is indeed full of errors so egregious that it's hard to believe that it's not misconduct. Your experience is just one example of what I think will be an avalanche in the coming weeks. E.g., here's another one: https://bsky.app/profile/andrewdessler.com/post/3lvegzzjue22p
It often seems that the scenarios previously in play for emissions are still in play in spite of evidence to the contrary: The US is no longer a part of the Paris Agreement and will not be involved in the next IPCC. Many other countries have backed away from pledges. I know in New Zealand, where I reside, the government has gotten rid of a dozen worthy initiatives that would cut GHGs. More generally, there are next to no action plans to meet the pledges that were made. The prospects for the future are now much bleaker.