

Over the past week smoke from Canadian wildfires has once again poured into cities across Canada and the northern US. Toronto briefly had the worst air quality of any major city on Earth, Thunder Bay’s readings went off the top of Canada’s air quality health index scale, and unhealthy air alerts stretched from Minneapolis to New York City.
This smoke-pocalypse has renewed a long-standing debate online that these fires aren’t really about climate change at all, but about forest mismanagement. Decades of aggressive fire suppression, the argument goes, have let fuel pile up. We don’t log enough, thin enough, or do enough prescribed burning The forests are overgrown tinderboxes and we have only ourselves to blame. Climate is a distraction from a problem we created by listening to Smokey Bear’s insidious propaganda.
I want to take this argument seriously, because it has a real kernel of truth. The fire-deficit story is a genuine phenomenon in the dry conifer forests of the western United States. But most of what’s burning in Canada is boreal forest, and the boreal is a fundamentally different beast. So in this piece I’ll try to explain why the management argument, largely valid in a California pine stand, mostly falls apart when you move it a couple of thousand kilometers north, and explore what the fire data actually shows.
Here’s the short version. Canada’s area burned has surged, and it has surged in step with warming: hot, dry fire seasons burn far more forest, with area burned rises roughly 80% for each 1C increase in fire-season temperature (with a correlation coefficient of 0.61). This relationship is robust to a variety of statistical tests and controlling for confounding variables. The boreal burns in rare, high-intensity crown fires on a natural cycle measured in a century or more, across enormous remote areas that have never been logged, thinned, or effectively suppressed. Only about a fifth of Canada’s burned area over the past four decades was even inside forest regions that have ever been actively managed. You cannot have a fuel-buildup from forest mismanagement in a forest you were never managing.
Forest mis-management?
The forest-mismanagement argument was, in fairness, based on real evidence from some regions. In the frequent-fire dry forests of the western US that are dominated by ponderosa pine and mixed conifers the natural fire regime is low-to-moderate intensity surface fire returning every 5 to 30 years, historically stoked in part by Indigenous burning. A century of fire exclusion in those forests really did remove that frequent fire, let stands grow denser and more continuous, and build up a “fire deficit” that raises the odds of severe fire (Hagmann et al. 2021). And in that setting, fuel treatments work: Prichard et al. (2021) find wide agreement that mechanical thinning combined with prescribed burning measurably reduces subsequent fire severity. If you’re arguing about the Sierra Nevada, the management story is as important if not more important than the climate one.
The problem is that the Canadian boreal is not the Sierra Nevada. It burns in infrequent, high-intensity, stand-replacing crown fires that kill the whole stand on natural fire cycles measured in many decades to centuries (commonly a century or more, and two centuries or longer in the east), not 5 to 30 years. It is, ecologically speaking, supposed to burn this way; black spruce is practically built for it. Fire in this system was never the gentle recurring ground-clearing that suppression interrupted in California. And the burning is astonishingly concentrated: across the boreal, something like 3% of fires account for about 97% of the area burned. This is not a landscape full of many small fires that “used to clean out the fuel.” Rather, its a landscape that waits, and then burns catastrophically under extreme weather.
Why do we know that Canadian boreal forest fires are not being driven by mismanagement?
First, and most importantly, most of the boreal was never being managed in the first place. As University of Alberta fire scientist Jen Beverly has pointed out, only about one-fifth of Canada’s total burned area from 1986 to 2023 occurred within long-term forest tenure (the land that’s actually logged and managed). The vast majority burns in remote forest with no timber operations. In Canada’s so-called “extensive” fire-management zones there has been no serious suppression efforts historically. Fires there are monitored and largely left to burn unless they threaten people or infrastructure. You can’t blame overgrown, over-suppressed forests for fires in places nobody was suppressing.
Second, the fuel-buildup mechanism doesn’t fit the recent fires. If decades of suppression had loaded the forest with excess old fuel, you’d expect the big fire years to preferentially consume the oldest, most fuel-laden stands. But in Alberta’s brutal 2023 season, fires burned stands of essentially all ages in proportion to how much of each was on the landscape. That’s the signature of fire driven by weather, which doesn’t care how old the trees are, not by fuel accumulation.
Third, the proposed fixes don’t scale to the boreal even if you wanted them. This is the conclusion of the very scientists who documented Canada’s fire deficit. Coogan, Parisien and colleagues (2020) state it flatly: mechanical fuel treatments “require continued maintenance over time, are too expensive to apply across large boreal landscapes, and are usually not designed to halt extreme wildfires.” The boreal is on the order of three million square kilometers. You are not going to thin or prescribe-burn your way across it, and the crown fires that produce the smoke wouldn’t stop at a fuel break anyway.
So if it’s not mismanagement, what is it? Let’s look at the data.
The Canadian fire record
To start with, here is the long-term record of area burned, combing the satellite-mapped NBAC composite from 1972 on with the less-complete point-based records before that shown in grey (note that this is primarily for illustration; I don’t compute any statistics across the 1972 splice to avoid potential bias from changing measurement approaches).
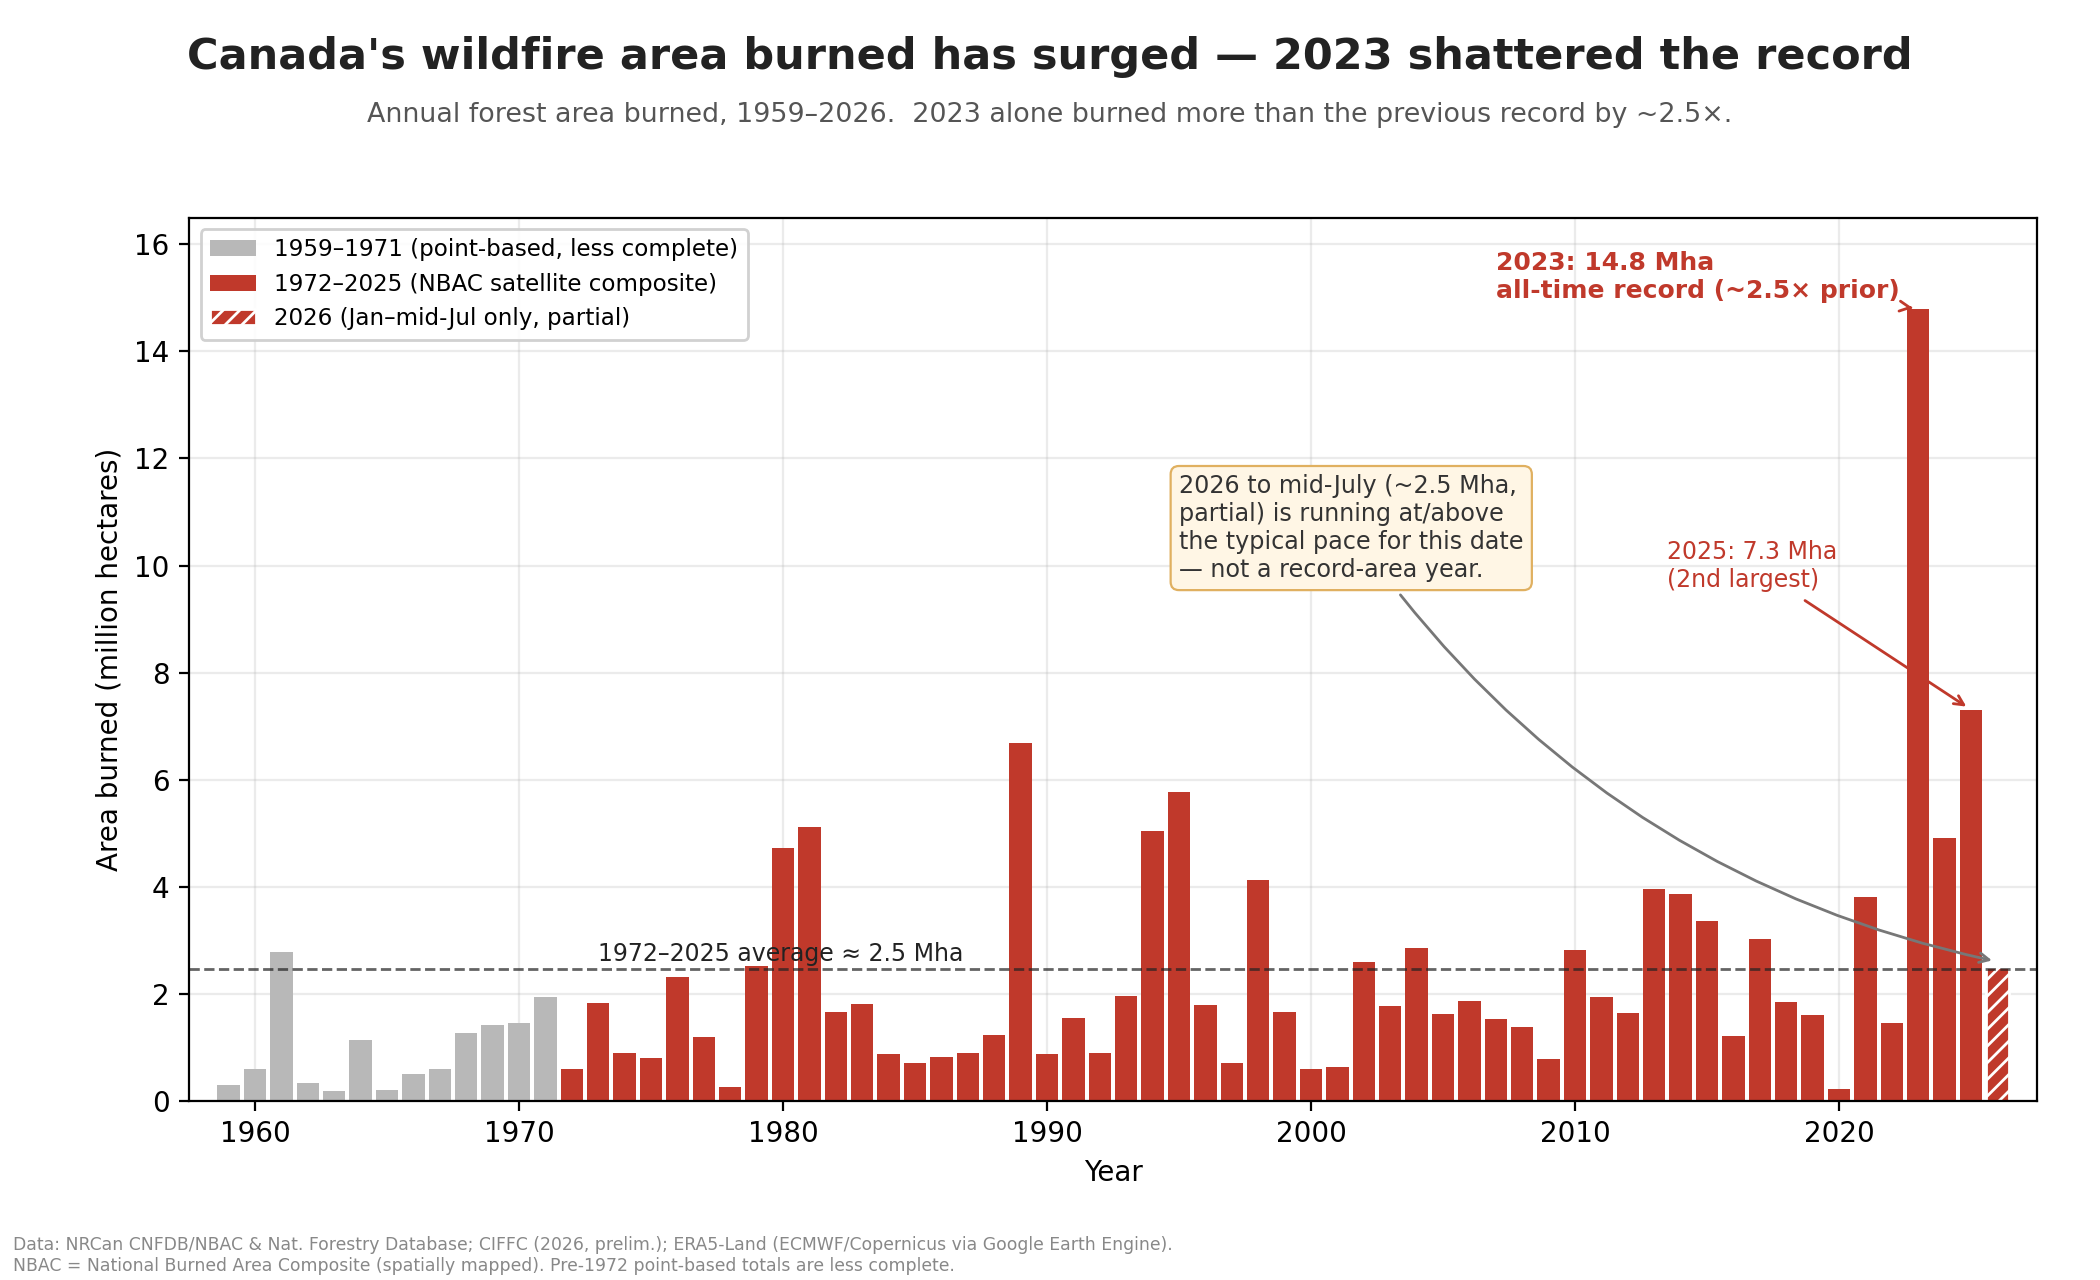
2023 stands out like a sore thumb with 14.8 million hectares in the satellite-mapped data (Canadian agency tallies actually run higher at 17–18 Mha as different products count differently),1 roughly 2.5 times the previous record. 2025 came in second at ~7.3 Mha in the satellite data. And 2026 so far is about 2.8 Mha by mid-July, a bit above the typical pace for this date, but far below the last few extreme years.
One caveat around how unprecedented this actually is. A recent tree-ring reconstruction back to 1800 (Danneyrolles et al. 2025) found that while 2023 itself was off the charts in most regions they studied, the decadal burn rate for 2014–2023 still sits within the range of the past two centuries in several zones, especially in the eastern boreal. We are not necessarily seeing more fire than ever everywhere, but rather a rapid rate of increase with the increasing prevalence of fire weather driving it. In addition, parts of the northwestern boreal are now burning at rates that do appear to exceed anything in thousands of years.
One important driver: higher temperatures
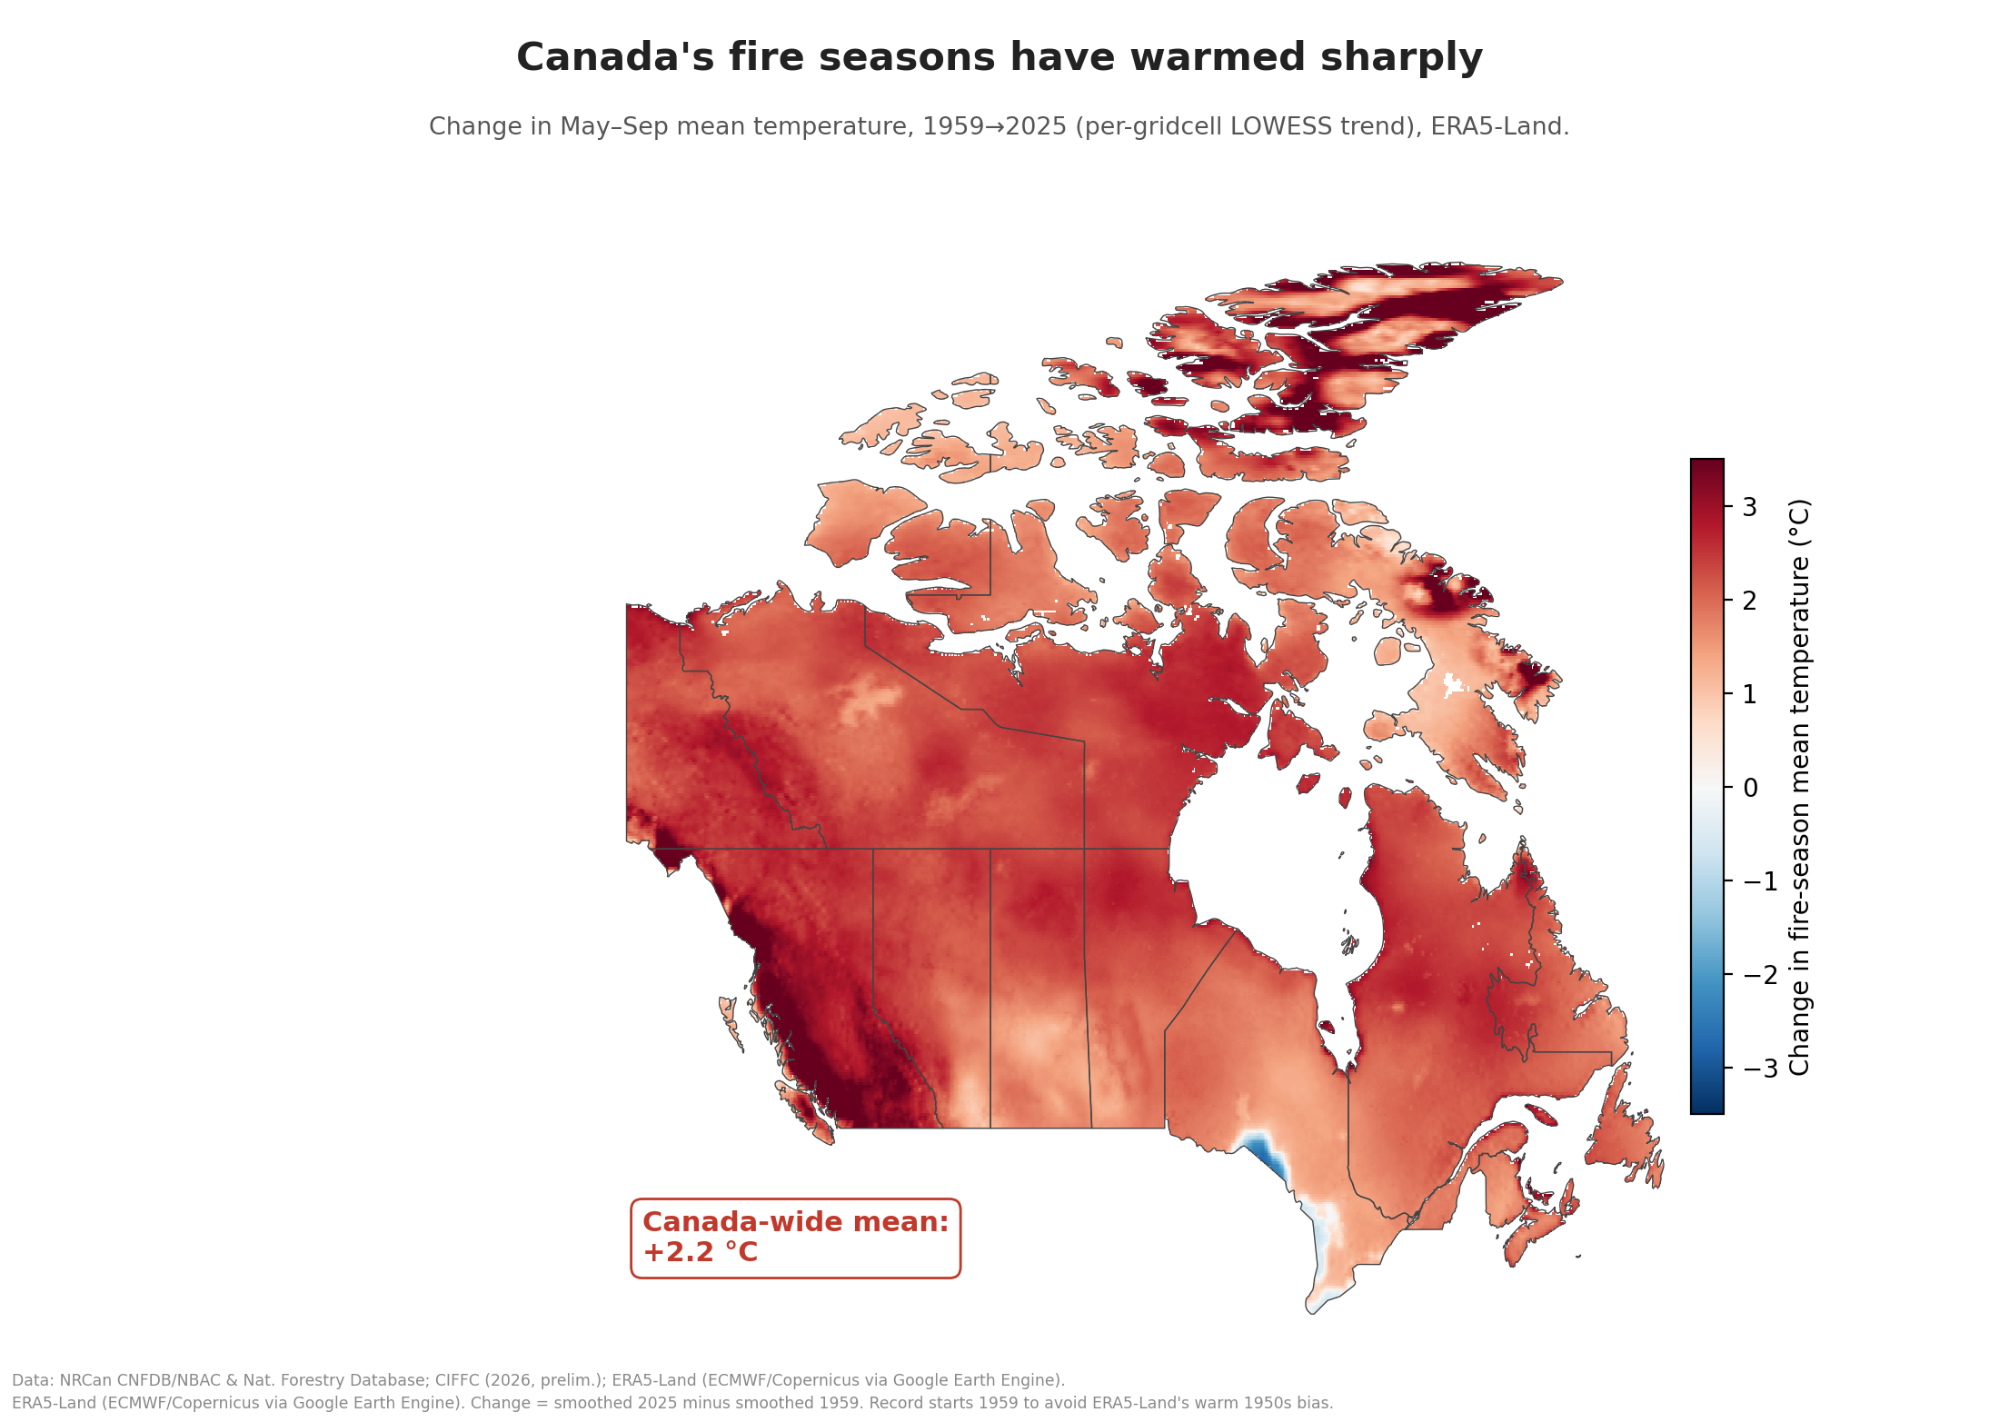
Canadian fire seasons (May through September) have warmed about 2.2C on average since 1959. Canada warms at roughly twice the global rate, and its north at roughly three times. That warming matters for fire through a well-understood mechanism: warmer air is exponentially “thirstier” (saturation vapor pressure rises ~7% per degree), so it pulls moisture out of live vegetation and dead fuels alike, priming the landscape to burn. It’s the same fuel-drying pathway that Abatzoglou and Williams (2016) found had roughly doubled cumulative forest area burned in the western US.
Hanes et al. (2019), examining the Canadian record from 1959 to 2015, found fire seasons starting earlier and ending later, more days with conditions suitable for fire spread, and increases in both annual area burned and the frequency of large fires. They found that these trends were consistent with human-caused warming, not with changes in forest management (which have been broadly stable since the 1980s even as the fire seasons have gotten dramatically worse).
Hot and dry years burn
A few years ago my Berkeley Earth colleague Robert Rohde made a lovely figure plotting each California fire season by its temperature and precipitation. Here is my Canadian version: every year from 1959 to 2025 placed in climate space, with dot size proportional to national area burned and the ten largest fire years outlined in black.
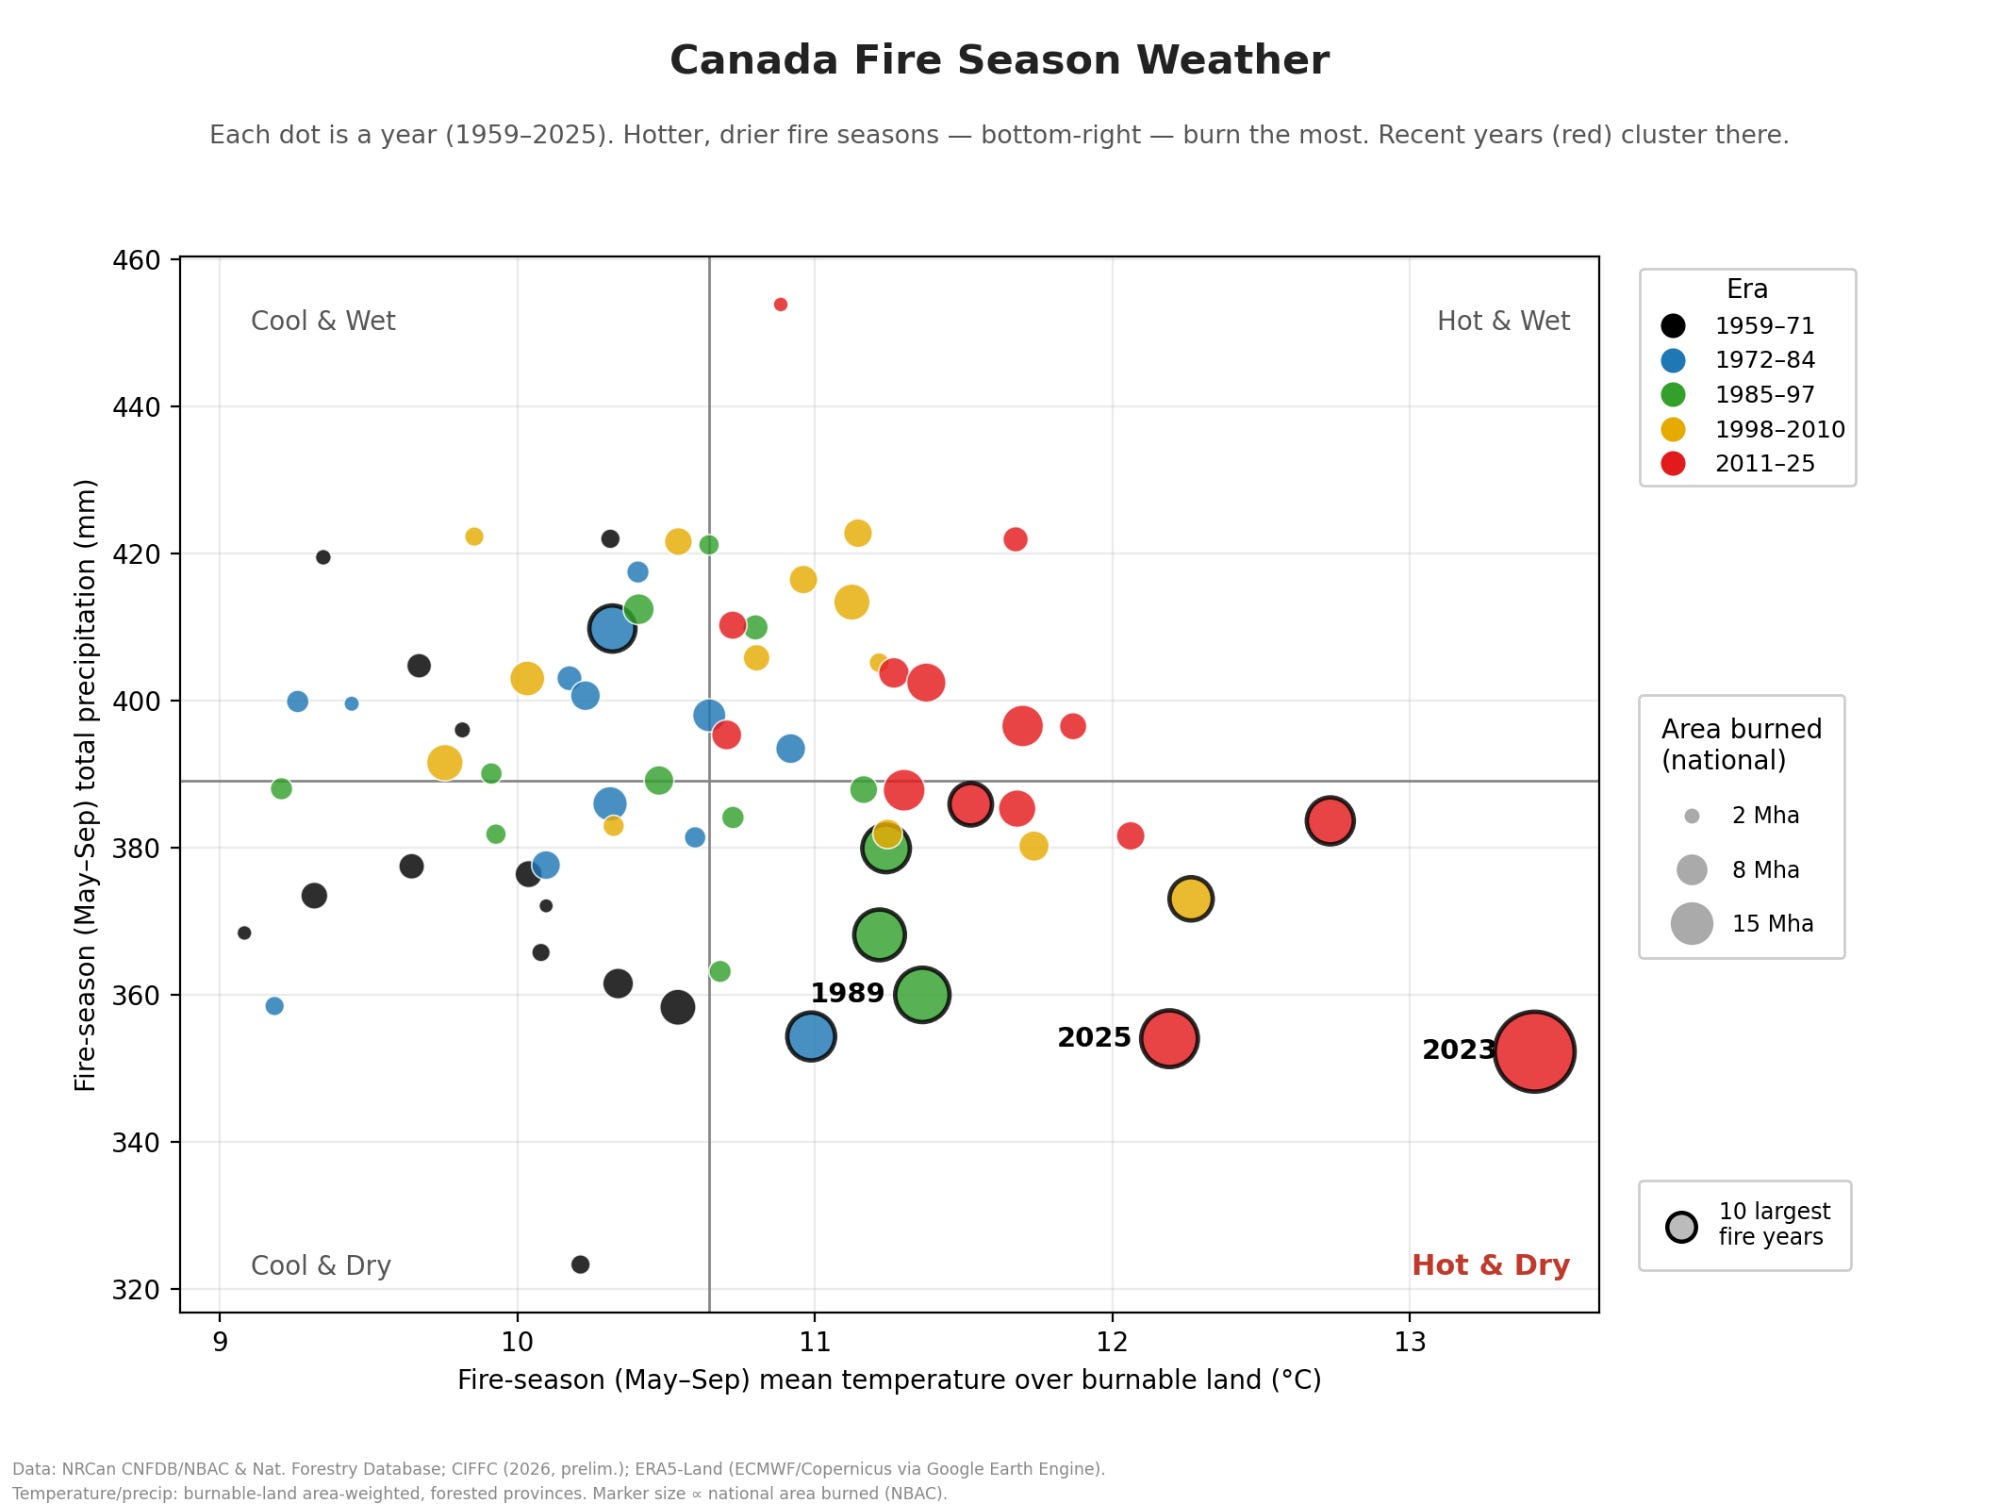
The pattern is hard to miss. The biggest fire years pile up in the hot-and-dry corner with 2023 really standing out, and the recent era (red dots, 2011–2025) has shifted visibly toward that corner relative to the black dots of the 1960s. Canada’s fire seasons are migrating into the part of weather-space where the big burns happen.
We can also try and more directly quantify the relationship between area burned and temperature. Nationally, fire-season temperature correlates with log area burned at r = 0.61 (1972–2025), which means that a fire season 1C warmer sees ~80% more area burned. I want to be careful about what this does and doesn’t show, so I stress-tested it: the correlation survives detrending (r = 0.57), first-differencing (r = 0.46), and partialling out precipitation (r = 0.58). It isn’t just two things drifting upward together, and it isn’t a rebranded precipitation effect.2
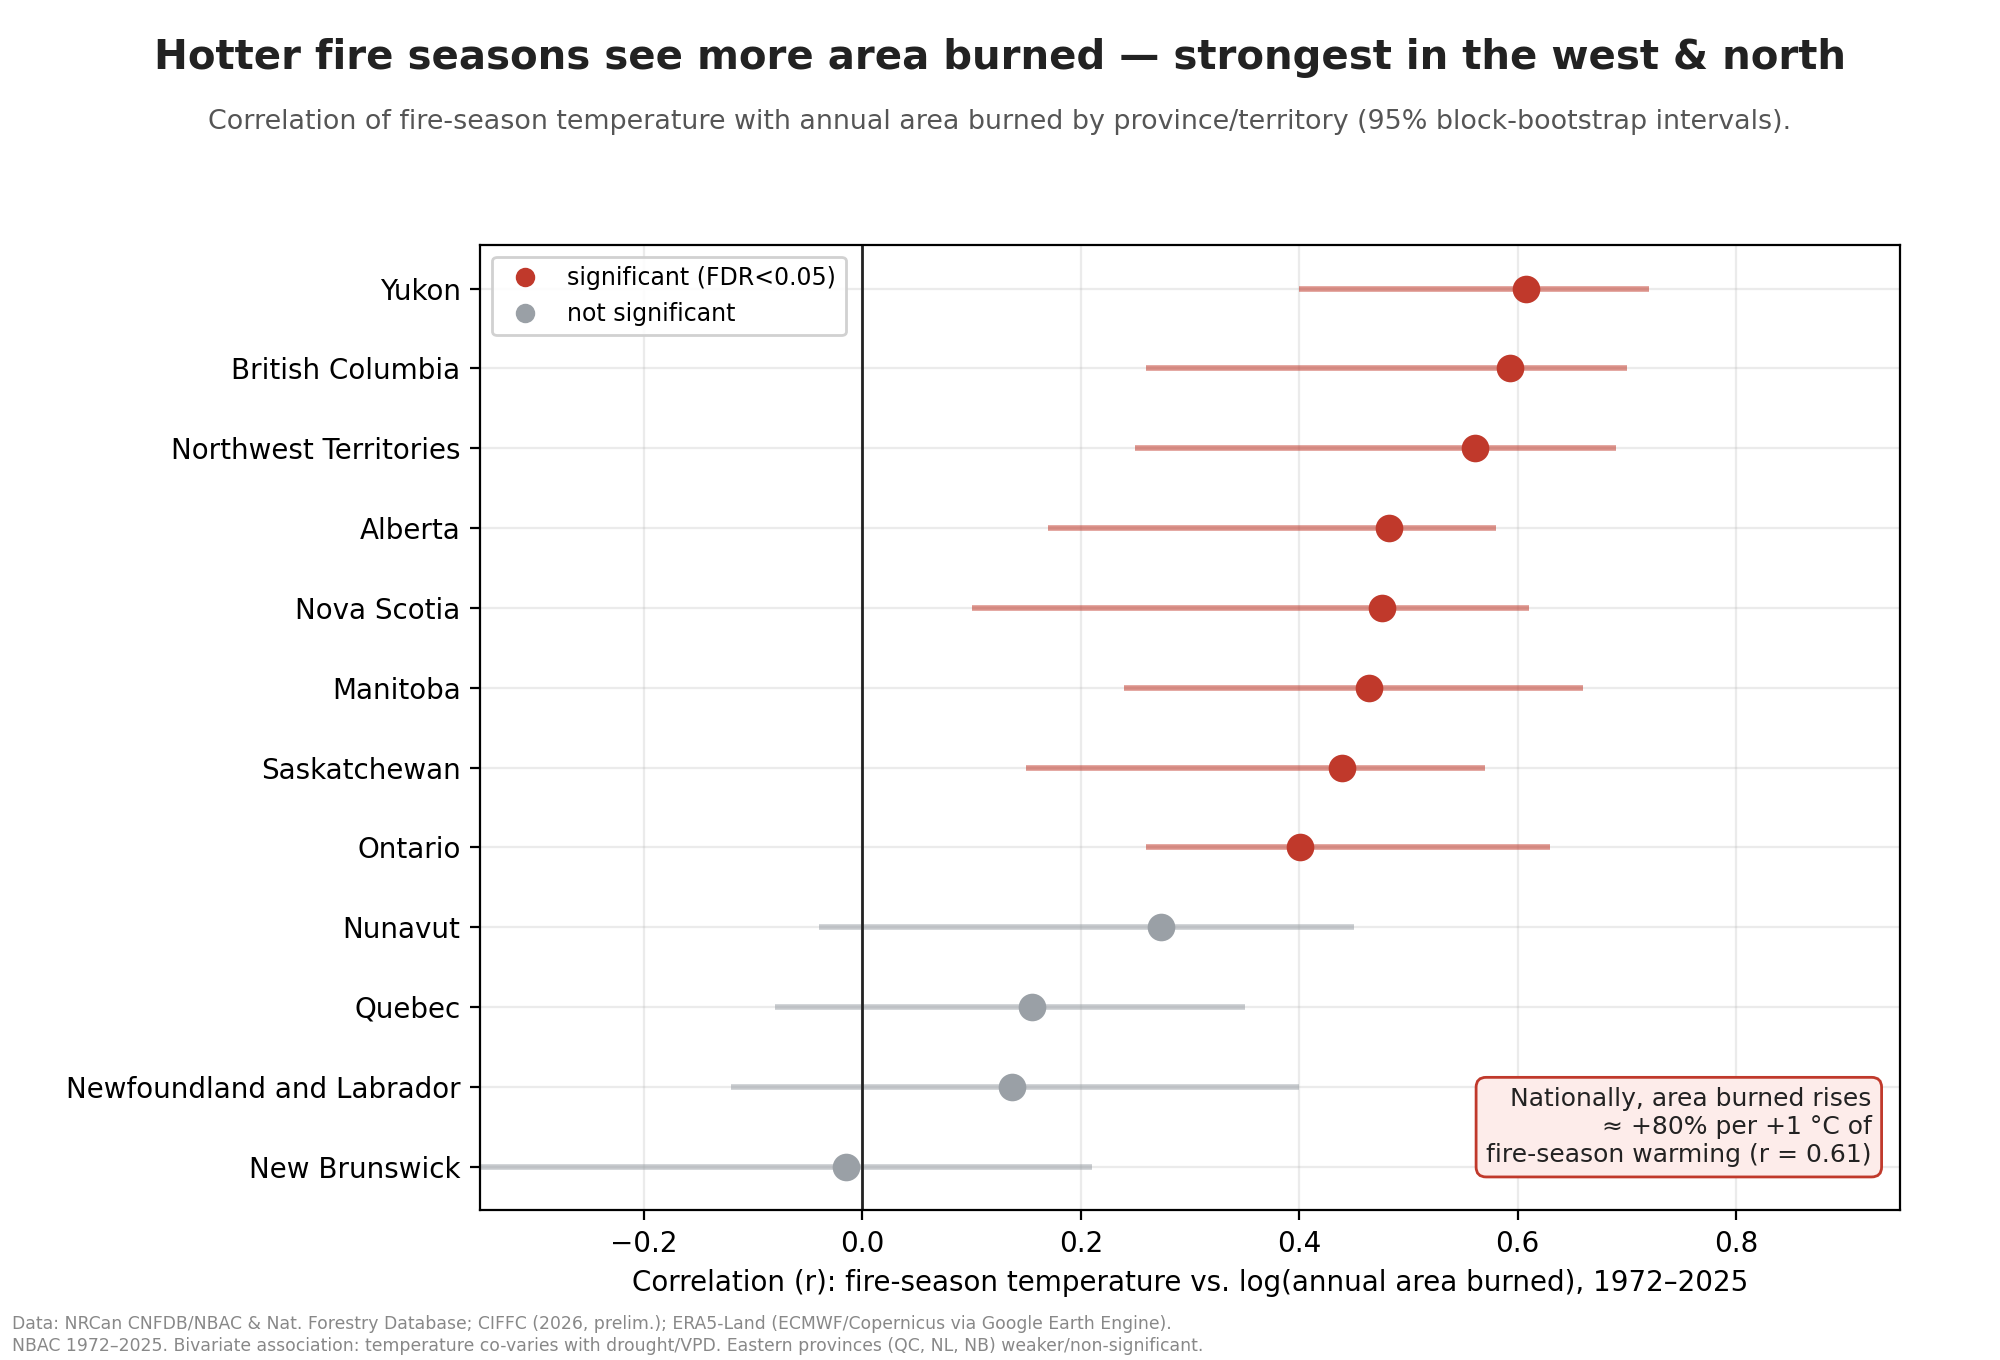
The relationship is strongest in the western and northern boreal – Yukon, BC, the Northwest Territories, the Prairie provinces, Ontario – and weak to non-significant in Nunavet, Quebec, Newfoundland, and New Brunswick, matching the literature’s finding that eastern boreal fire is generally less temperature-limited.
Lightning in the middle of nowhere
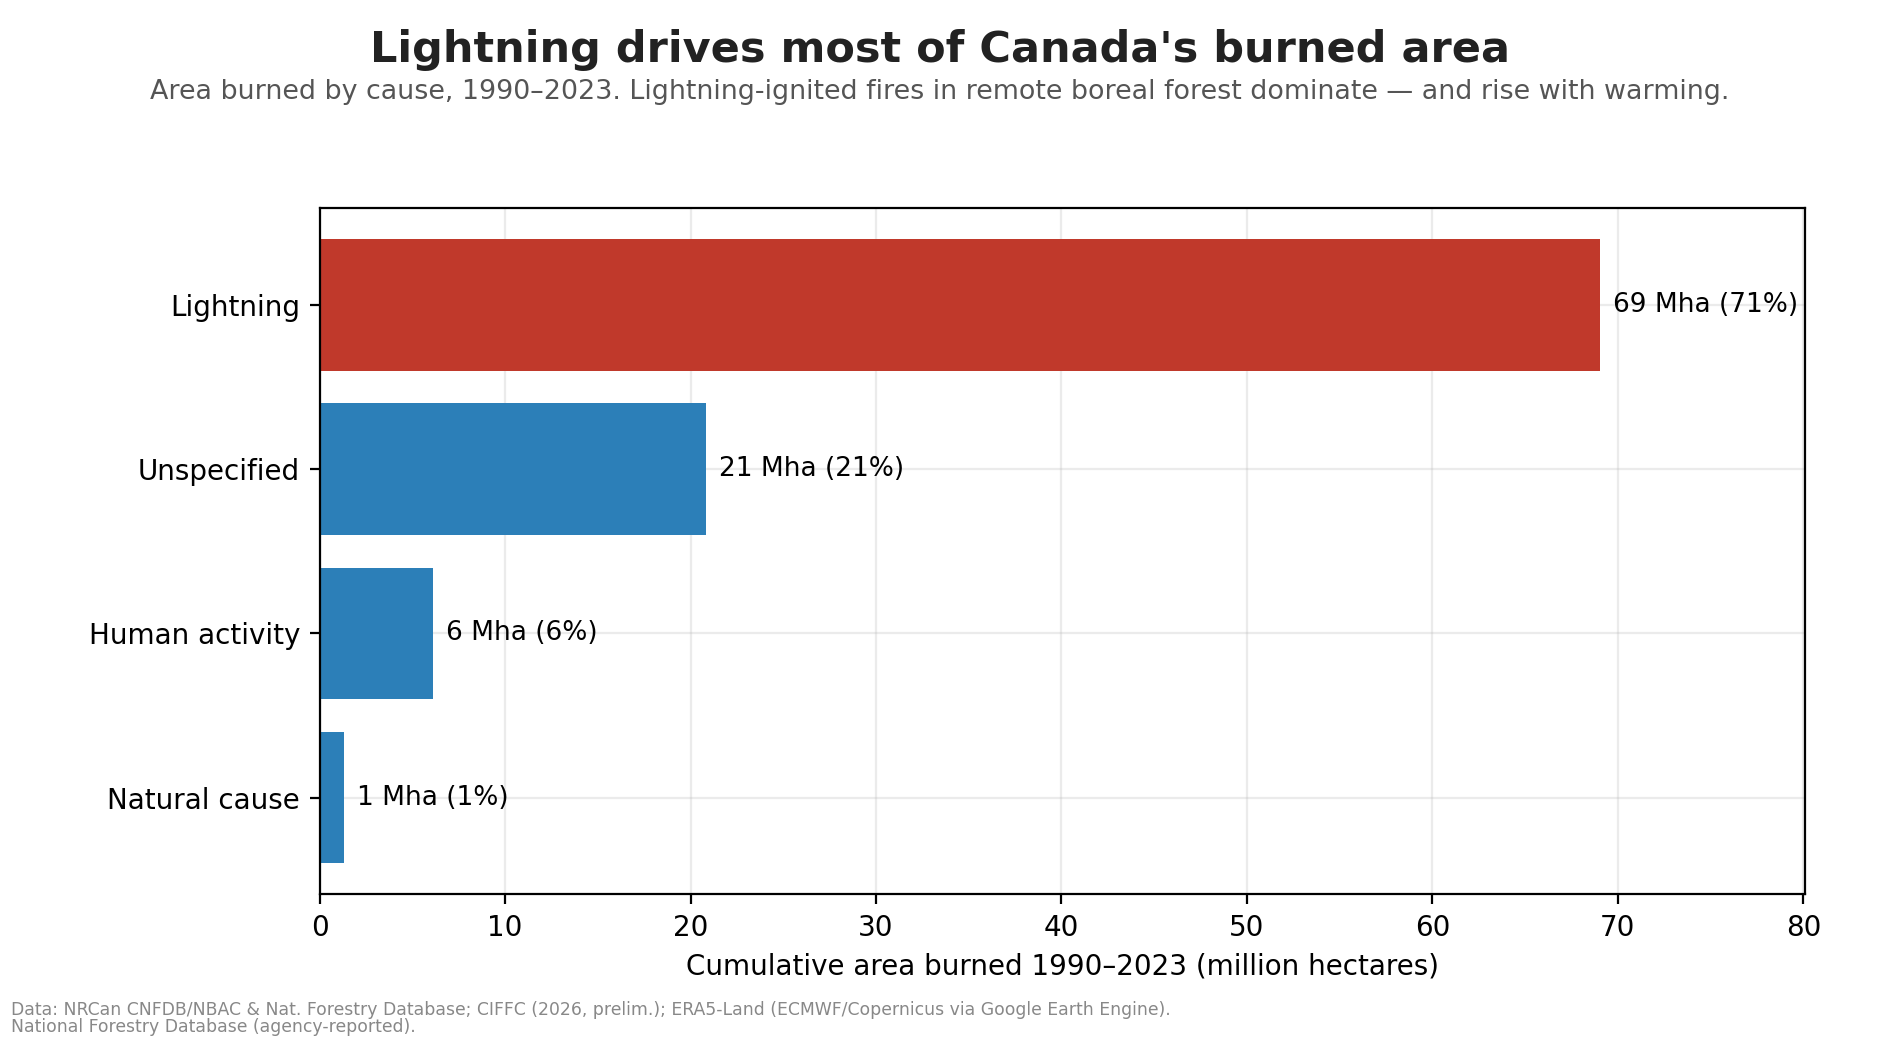
About 71% of Canada’s area burned over 1990–2023 came from lightning-ignited fires, and in the record 2023 season it was ~93%. These are remote boreal megafires, ignited by lightning far from any road, timber lease, or fuel-treatment crew. This is worth considering in the context of the management debate: the fires driving the smoke are not escaped campfires or mismanaged plantations. They are lightning strikes into a drying landscape, often burning in exactly the places no one was managing. And because warming is expected to increase high-latitude lightning, climate change can contribute to both the fuel dryness and the ignition side of the equation.
What attribution science actually says
This week the National Academies released a major report on the attribution of extreme weather events and their impacts, updating their influential 2016 assessment. Its wildfire findings are careful, and they land almost exactly on the distinction I’ve been trying to make in this piece.
On the general question, the report concludes it is very likely that climate change has increased the likelihood and severity of extreme fire weather: the hot, dry, windy conditions that let fires ignite and spread. At the same time it assigns low confidence to attributing any specific individual wildfire, because fires are irreducibly multivariate: ignition, fuels, land management, and suppression all mediate the on-the-ground relationship between fire weather and hectares burned. Notably, the report also flags that no attribution study has yet isolated the role of fuel or ignition changes, precisely because those human factors are so entangled. The science is much stronger on “climate change made conditions like these more likely” than on “climate change, specifically, caused this fire.”
For Canada’s exceptional 2023 fire year the evidence is unusually strong, and the report devotes a whole box to it. Kirchmeier-Young et al. (2024) found the record burned area was 2–5 times more likely thanks to human influence in Canada’s eastern and western ecozones, and the extraordinarily long fire season more than 5 times more likely. World Weather Attribution found the cumulative fire-weather severity at least 7 times more likely and ~50% more intense. Jones et al. (2024) put the fire-weather likelihood increase at ~2.9–3.6x and burned area ~10% higher (95% CI: 3-40%) than without warming. And Barnes et al. (2025) found the James Bay severity rating at least 32% more intense, while noting the season was amplified by an extreme run of atmospheric blocking (~50 blocking days versus an average of 15), a reminder that in any single year the weather still matter enormously.
Where management does matter
The prior sections are about the physical science of what’s driving the fire trend. What we should do about it is a policy question, and here the management crowd is not wrong so much as aiming at the wrong target.
There genuinely is a fire deficit in parts of boreal Canada — but it’s local, and it’s about people, not country or regional fire totals. Parisien, Coogan and colleagues (2020) found that of 160 boreal communities they studied, 54% were surrounded by less recently-burned forest than their fire regime would predict reflecting a suppression legacy that leaves older, more flammable forest ringing towns. This is a place where thinning, fuel breaks, and prescribed burning could genuinely help.
Fuel management is valuable around communities, but is essentially useless across the remote boreal. But in Canada it does not explain and cannot reverse the rise in area burned that’s filling the sky with smoke. Treating the wildland-urban interface and cutting the emissions that are drying the forest should be seen as complementary rather than as competitors.
Why the smokey skies
One last point on the thing thats actually dominating the news a the moment. Even a year like 2026 that appears not to be headed for a top-5 record for area burned in Canada can still have catastrophic air pollution impacts.
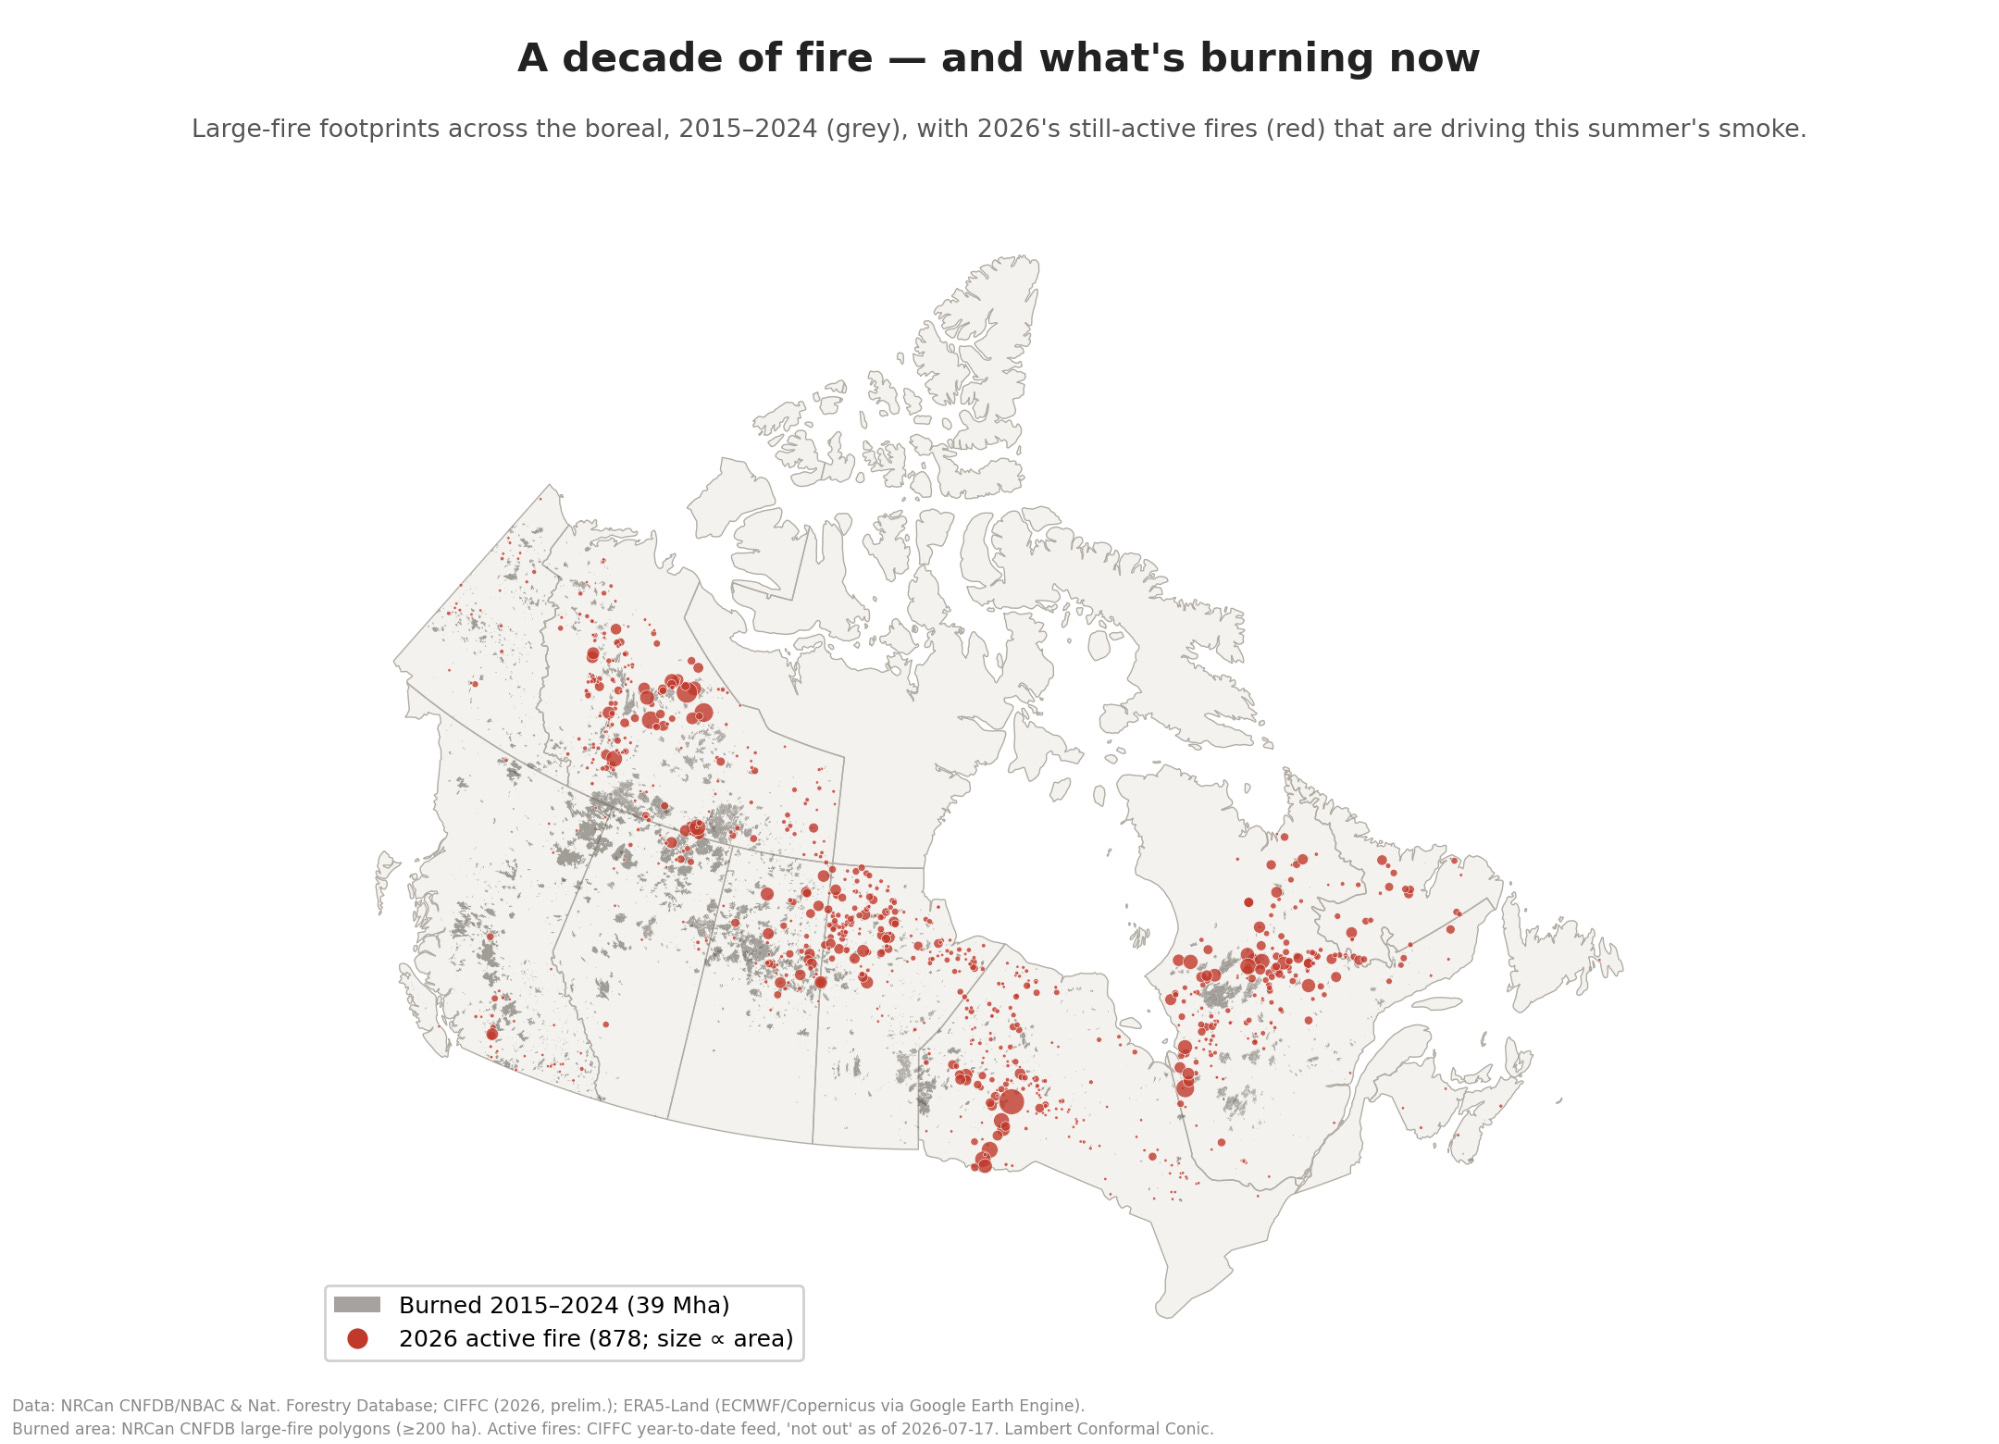
Whether a given city chokes on smoke depends on where fires burn, how high their plumes loft, which way the wind blows, and how many people live downwind, not on total hectares burned nationwide. This July, fires across northwestern Ontario, the Prairies, and Quebec have sat upwind of the Great Lakes population corridor under a persistent transporting flow. A modest fire season in the wrong place can choke tens of millions, while a record season in the remote north can have much smaller impacts on populated regions. While overall area burned is the climate-linked trend, who breathes the smoke on a given week in July is mostly driven by the weather.
A few takeaways
So what are the takeaways here?
First, the forest-mismanagement explanation is borrowed from the wrong forest. Its a real problem in the frequent-fire dry forests of the western US, but the Canadian boreal is a rare-crown-fire system, mostly unmanaged and unsuppressed, where only about a fifth of the burned area is even on managed land and where the fire scientists themselves say landscape-scale fuel treatments can’t scale or stop the megafires.
Second, the surge in Canadian burning tracks temperature with striking consistency, and hotter, drier fire seasons burn far more forest (+80% per 1C), the biggest fire years are almost universally hotter and drier, over 90% of the record 2023 burn was remote lightning fire, and the attribution studies tie these extremes to a warmer atmosphere without needing to invoke forest management at all.
And third, where management does matter like for the forests ringing communities it’s a genuine and worthy fix. But here it just protects towns; it doesn’t solve the underlying factors driving area burned or wildfire smoke pollution.
So next time someone tells you Canada’s fires can be solved by raking the forests, you can point out that the thing filling their sky with smoke is a lightning-struck, drought-primed boreal forest doing what a warming climate is making it do more and more often.
In case its helpful, I’ve put the code and data to reproduce this analysis on my GitHub here.
Burned-area products genuinely differ: the National Burned Area Composite (NBAC) maps fire perimeters from satellite imagery and is more conservative, while agency/CIFFC tallies are reported figures with different cutoff dates (2023 is 14.8 Mha in NBAC vs ~17–18 Mha in agency totals). I use NBAC as the primary series and avoid computing statistics across the 1972 data-source splice; the 2026 number is a preliminary CIFFC year-to-date figure.
The gory methodological details: correlations use the homogeneous NBAC record (1972–2025), with effective sample sizes adjusted for autocorrelation (Bretherton et al. 1999), 95% moving-block bootstrap confidence intervals, and Benjamini–Hochberg false-discovery-rate control across jurisdictions. The national relationship also holds when refit excluding 2023 and 2025 (r = 0.52), so it is not an artifact of the two recent extreme years. Temperature and precipitation are area-weighted over each jurisdiction’s forested/woody land (MODIS IGBP classes 1–9) from ERA5-Land. Fire-season precipitation correlates with area burned at r = −0.49.
I live in the woods. The conifers have been limbed up 30+ feet and there is a 30 foot buffer around my house and some of the other structures. I have no illusion that this action would save my house, because I expect a hot east wind flaming a crown inferno, but I hope it gives me time to evacuate out to the slough.
In the 20 years I’ve lived here the climate has changed immensely. It is so much hotter and dryer. And yes, I tracked climate as part of my job, before I retired.
Thank you for your analysis. An additional component to consider in future analyses is the fact that starting in the 1600s, indigenous fire management of the landscapes in question were actively suppressed across much of the boreal forest region, and yet those fire management traditions are still alive in many of the 600 predominantly indigenous communities across the north woods. There has been a quiet revolution that has been going on, with the realization that those indigenous burns, small in scale and well timed earlier in the year, can head off much of the large scale dangers that are inherent in boreal forests that are not logged or otherwise accessed by western lumber/agricultural interests. It is a misnomer to say that these boreal forests were not actively managed just because they weren't being logged. For an excellent research paper outlining these practices and their results on biodiversity, forest composition, wildfire management and human's relationship to these forests, I recommend reading "Centering Indigenous Voices: The Role of Fire in the Boreal Forest of North America" in the journal Fire Science and Management: https://link.springer.com/article/10.1007/s40725-022-00168-9