Anatomy of a heat wave
sunny days aren't all they're cracked up to be
Heatwaves can bring on more than just a sweat; they can trigger health crises, damage infrastructure, affect our economy, and even reshape the natural world around us. But what actually causes these periods of unusually hot weather? Let's take a dive into the meteorology that is responsible for these scorching conditions.
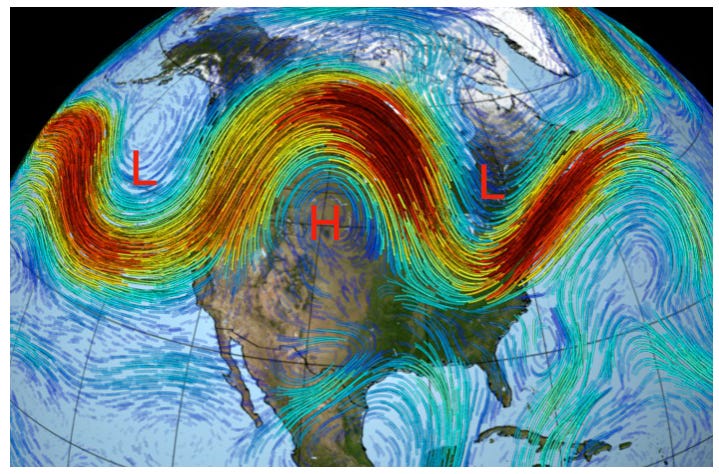
Due to the temperature gradient between the pole and equator, both hemispheres feature jets of wind flowing from west to east in the mid-latitudes (aka the jet stream). These jets are unstable, so ‘ripples’ tend to form on it. Anyone who looks at weather maps knows what they look like. This NASA animation shows the jet as red and yellow colors and you can see how it waves back and forth.
High-pressure systems are key to heat waves, and they form in “ridges” in the jet stream:
The “H” indicates the location of a high-pressures system while the “L”s indicate low-pressure systems.
To understand why heat waves are associated with high pressure, first realize that surface air flows away from high pressure and towards low pressure. If the air at the surface is flowing away from the high pressure, then by conservation of mass, there must be descent in the column.

Sinking air brings down air with very low water vapor from the cold upper atmosphere down into the mid and lower atmosphere. This very dry air prevents clouds from forming.
In addition, descending air is heated as it is compressed, so the column of air is also quite warm, leading to extremely stable conditions. Stability in this context means vertical motion is suppressed, i.e., thunderstorms or other rain events are strongly disfavored.
But, you might ask, “Why is it so humid outside?” To understand this unpleasant aspect of heat waves, realize that we live in a very thin layer of air near the ground known as the “planetary boundary layer”:
The boundary layer is humid because the surface is a source of water vapor: evaporation from surface water, like lakes or the ocean, transpiration from plants, etc. In high-pressure systems, the strong temperature inversion at the top of the boundary layer traps humidity in this thin layer where we live and it gets very humid there.
The net result of all of this atmospheric physics is an atmosphere with high near-surface humidity that is also devoid of clouds and rainfall. While this makes beautiful blue skies, it also allows a lot of sunlight to reach the Earth's surface. As the ground absorbs heat, temperatures rise.
Normally, these conditions stick around for a day or two and then the high-pressure system moves to the east (you can see this in the video above). However, meteorological conditions can sometimes lead to a high-pressure system parking over a region, a process known as blocking.
In such a situation, a region experiences a long period of clear skies and no rain. This dries out the ground and, once the soil moisture is gone, all of the remaining solar energy goes into warming the surface and the temperatures soar. Along with the humidity, this can produce dangerously hot conditions.
Climate change has an amplifying effect on heatwaves. Just like the adage “a rising tide lifts all boats,” a warming climate raises the baseline temperature from which heatwaves start. This means that our heatwaves become hotter, essentially ‘floating’ on the ‘rising tide’ of our warming world. This increase in the intensity of heatwaves is one of the many impacts we’re already seeing from climate change.


I keep thinking about the heat waves, air conditioners, and the prisoner's dilemma the world is in today.
Interesting and educational explanation of heat waves. But the suggested climate change impact doesn't seem to fit the historical data. One easily accessible measure of June heat intensity is Cooling Degree Days (cumulative monthly difference of daily average temp from 65F). Looking at Brazos County, TX from 1895-2022, there is not a climate change signal.
https://www.ncei.noaa.gov/access/monitoring/climate-at-a-glance/county/time-series/TX-041/cdd/1/6/1895-2023?base_prd=true&begbaseyear=1901&endbaseyear=2000
There is a weakly positive but statistically insignificant relationship between CO2 concentration and June Cooling Degree Days in Brazos County. (t=1.19). For sure, there have been some hot Junes in the past few 10 years or so, but there were similarly hot Junes back in the early 1900s, according to NOAA data.
It's the same with Maximum Temperature. No relationships between June Max temps in Brazos County and atmospheric CO2 concentrations.
https://www.ncei.noaa.gov/access/monitoring/climate-at-a-glance/county/time-series/TX-041/tmax/1/6/1895-2023?base_prd=true&begbaseyear=1901&endbaseyear=2000
Is there a better metric of heat waves over the past 125 years that demonstrates the climate change signal?